
How JDK 26 Improves G1 Throughput: Write-Barrier Synchronization and the Default Collector Roadmap#
Abstract#
Since JDK 9, most server configurations default to Garbage-First (G1) when no collector is explicitly specified, prioritizing GC pause control over raw throughput under typical loads. The cost falls on application threads: every heap reference-field store goes through a heavier write barrier and shares the card table with background optimizer threads, which historically required fine-grained synchronization. JEP 522 shipped in JDK 26—introducing a second card table, atomically swapping the two tables, and using JEP 312 thread-local handshakes to align visibility at swap time—cutting synchronization overhead without adding mandatory user-facing switches. The longer-horizon JEP 523 proposes extending “G1 whenever no collector is specified” to single-CPU and small-memory environments; as of 2026-05 its status is Proposed to Target (Release 27) and is not yet Delivered. This article follows the mechanism chain; numbers and flags are taken from JEP / Oracle documentation; details not spelled out verbatim in the JEPs are labeled speaker opinion.

Why the default path chooses latency first, then throughput#
Why#
In online services and interactive workloads, multi-second pauses often show up directly in tail latency. JEP 248 states the motivation plainly: Limiting GC pause times is, in general, more important than maximizing throughput. HotSpot therefore switched the default on 32/64-bit server configurations from Parallel GC to G1, using concurrent marking and region-by-region incremental reclaim to avoid Parallel-style “whole-heap stop-the-world” worst cases. The side effect: many “zero tuning” processes have run on G1 for years, while G1’s mutator path is heavier than Parallel/Serial—one engineering reason throughput was often considered weaker than Parallel before JDK 26.
Mechanism and constraints#
- Throughput: Oracle GC implementation and performance considerations defines it as percentage of total time not spent in garbage collection.
- Latency: the same document stresses how pauses affect responsiveness.
- G1’s pause target is a soft goal: the
javamanual for-XX:MaxGCPauseMillis=says the JVM will make its best effort; the Oracle G1 tuning guide options table lists a default on the order of 200 ms (use that table, not podcast oral figures). - JEP 522 Non-Goals: delivery is not aimed at matching Parallel throughput.
- Parallel / Serial remain: JEP 523 Non-Goals states explicitly that Deprecate or remove any existing collector is not a goal.
How to#
java -version
java -Xlog:gc=info -version          # print the collector actually chosen at startup
jcmd <pid> VM.flags | grep -E 'UseG1GC|UseSerialGC|UseParallelGC'
For throughput-sensitive batch jobs, compare explicitly:
java -XX:+UseParallelGC -Xlog:gc*:file=parallel.log -jar app.jar
java -XX:+UseG1GC      -Xlog:gc*:file=g1.log      -jar app.jar
Common misconceptions#
- Treating “G1 by default since JDK 9” as every environment (including embedded and single-core containers)—JEP 523 Motivation still notes Serial by default on single CPU or physical memory < 1792 MB.
- Declaring “G1 is always slower than Parallel” or “always faster” without A/B benchmarking—measure per workload and JDK minor version.
- Treating
MaxGCPauseMillis=200as a hard SLA—the manual and tuning guide both stress it is a goal; GC can still briefly exceed it under extreme allocation spikes; capacity planning should use P99 pause and allocation rate, not the default alone.

Write barriers, card table, and regions: where the throughput tax lands#
Why#
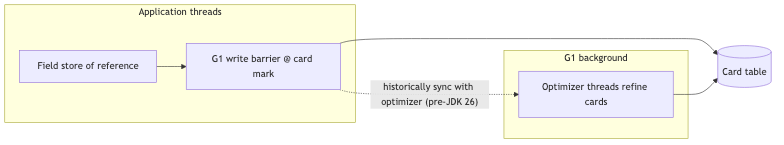
G1 splits the heap into regions and copies live objects during reclaim while maintaining cross-region references. Scanning the whole heap on every pause would break pause targets. HotSpot therefore injects a write barrier for G1: every time an object reference is stored in a field it updates the card table so pauses only process dirty cards (JEP 522 Background). Oracle G1 — Remembered Set states the default 512 B heap chunk maps to 1 B per card-table entry. Oral examples often cite “old-gen field points to young gen”; official text is cross-region first, consistent with the region model—do not treat the spoken example as the only normative wording.
Relative to Parallel/Serial, G1 must coordinate with GC threads; synchronization lowers throughput and increases latency (JEP 522 Motivation). On x64 the barrier was once on the order of 50 instructions, optimized to about 12 (JEP 522 Performance—OpenJDK official benchmark conclusion, not a promise on your machine).
Mechanism and constraints#
- Post-write barrier: the main barrier body after a reference
storeon a field; Parallel/Serial also have card-marking logic. - Pre-write barrier (for concurrent marking; absent in Parallel/Serial): speaker opinion—the JEP 522 / Oracle excerpts checked for this article do not spell out the division of labor verbatim.
- Same-region stores may skip some remembered-set work: speaker opinion—public tuning docs do not give the branch algorithm sentence by sentence; for internal architecture notes, cross-check HotSpot source and tag the version.
- Missing a dirty card can let the collection set miss references—a GC correctness risk; oral material mentions possible process crash; JEP 522 does not mention crash—label as speaker opinion.
How to#
java -XX:+UseG1GC -XX:MaxGCPauseMillis=200 -Xlog:gc*,safepoint -jar app.jar
java -Xlog:gc+ergo=info,gc+region=debug -jar app.jar
jcmd <pid> GC.heap_info
Common misconceptions#
- Blaming G1 slowness broadly on “too many concurrent GC threads”—the per-reference barrier tax cannot be removed by tuning thread counts alone.
- Driving
MaxGCPauseMillisvery low while expecting unchanged throughput—more aggressive reclaim usually sacrifices mutator time share.


Background optimization and mutator contention: how pause-oriented engineering hurts throughput#
Why#
When allocation and reference stores are very fast, dirty cards pile up before a pause; cold-scanning the whole active table inside the pause can exceed its pause-time goal (JEP 522 Background). G1 therefore uses optimizer threads that optimize the card table in the background, shifting work into concurrent phases and pairing with the remembered set so pause work stays incremental. The cost: optimizer and mutator must synchronize to avoid conflicting updates on the same table—barriers become complex and therefore slow (same JEP Background). JEP text mostly says optimizer threads; VM flags include G1ConcRefinement (see Risks)—oral “concurrent refinement” should be cross-checked against formal terms, not treated as one official name.
Mechanism and constraints#
-XX:-G1UseConcRefinement: disable optimizer threads entirely (JEP 522 Risks).-XX:G1ConcRefinementThreads=<n>: cap thread count.- Turning refinement off is not a JDK 26 “throughput hack”—it usually lets dirty cards pile up and lengthens pauses, opposite to JEP motivation.
How to#
java -Xlog:gc+refine=debug,gc+task=debug -jar app.jar
jcmd <pid> VM.flags | grep G1ConcRefinement
Common misconceptions#
- Running
-XX:-G1UseConcRefinementlong term in production “to reduce background threads”—may trade a throughput illusion for longer pauses. - Looking only at GC-thread CPU while ignoring mutator icache / instruction-count cost on barriers.

JDK 26: dual card table, table swap, and thread-local handshake#
Why#
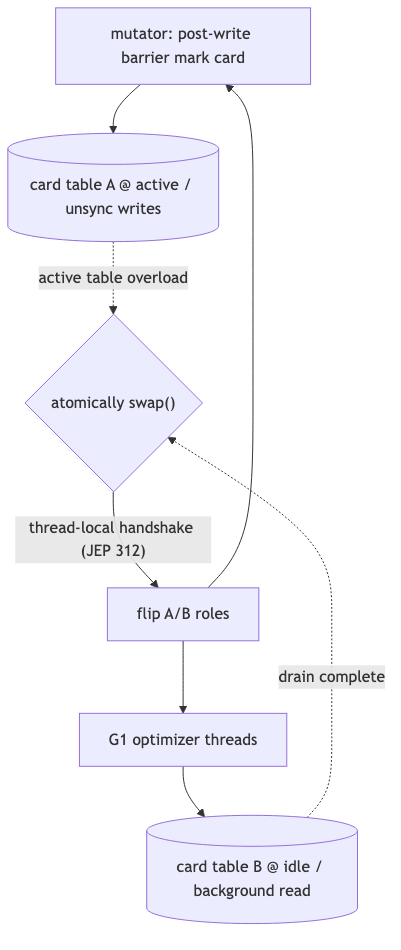
JEP 522’s first goal is Reduce synchronization overhead. Core idea: introduce a second card table; the mutator updates the active table without any synchronization; the optimizer works on the other table; when scanning the active table before a pause might time out, G1 atomically swaps the two tables—the mutator marks on the empty table while the optimizer drains the full one (JEP 522 Proposal). At swap time all Java threads must see the new active-table pointer; Alternatives document generic thread-local handshakes (JEP 312)—without performing a global VM safepoint. Oral “no Full GC pause needed for this” aligns with JEP 312 direction; JEP 522 Proposal does not step through the handshake protocol on every swap—do not write that as JEP-level implementation detail.
Mechanism and constraints#
| Item | Source |
|---|---|
| No new mandatory user switches | JEP 522 Goals |
| Each table | JEP 522 Native memory |
| Second table replaces auxiliary data structure; total native may be lower | same section |
| 5–15% throughput in heavy reference-write scenarios; barrier 50→12 instructions (x64) | JEP 522 Performance (official benchmark) |
| Invasive change carries correctness/performance regression risk | JEP 522 Risks |
-XX:ThreadLocalHandshakes defaults to true | JEP 312 |
How to#
java -version   # confirm 26+
java -Xlog:gc+refine*=debug,gc+start=info -jar app.jar
java -XX:StartFlightRecording=duration=120s,filename=jdk26-g1.jfr -jar app.jar
Upgrade comparison: under the same load, same heap, and same -Xmx, compare application throughput (JMH / business load test), gc+refine logs, and JFR jdk.GCPhasePause distribution between JDK 25 and 26. If business metrics barely move, check whether the workload is sparse on reference writes or the process is already bound to Parallel—JEP 522 Performance’s gain band naturally misaligns with those cases.
From an implementation angle, dual tables time-split “mutator writes” and “optimizer read/organize” onto different physical tables, removing lock contention on one table in the steady path; swap cuts the “active table that must be finished before pause” from the “dirty-card stream still growing.” JEP 522 Alternatives also mentions OS-level atomic swap ideas, ultimately choosing thread-local handshake to reduce platform variance—specific handshake callbacks are not expanded in Proposal; for production triage, rely on unified logging and JFR, not invented step-by-step protocols in incident reports.
Common misconceptions#
- Treating JEP 522’s 5–15% as a guaranteed lift for every Java app—official wording is limited to heavily modify reference fields class benchmarks.
- Disabling
ThreadLocalHandshakesfor troubleshooting (unless JEP 312 dependencies are understood)—may affect swap visibility paths (check release notes for your version). - Assuming JDK 26 already equals JEP 523 “G1 default everywhere”—the latter is not yet Delivered.


Native memory, small-configuration defaults, and collector survival#
Why#
Dual tables add footprint, but the JEP also replaces old auxiliary queue/structures—total native may not rise on some deployments. Longer term, JEP 523 argues G1 slimmed over years (oral mentions marking bitmap, compressed remembered set, etc.) and throughput is the last major gap versus Serial; with JEP 522 filling that gap, always select G1, regardless of the number of processors and the available physical memory becomes viable as default policy. Oral “marking bitmap ~2.5%”—speaker opinion; that number does not appear in JEP 522; capacity planning should use NMT / measurement.
Mechanism and constraints#
- JEP 523: Release 27, captured 2026-05 as Proposed to Target.
- Non-Goals: do not deprecate Parallel / Serial; CMS precedent (JEP 291 deprecate, JEP 363 remove in JDK 14) cannot imply Parallel “about to be removed”—speaker opinion: maintaining multiple collectors has cost; future removal undecided.
How to#
java -XX:NativeMemoryTracking=summary -jar app.jar
jcmd <pid> VM.native_memory summary scale=MB
# single-core / small-memory containers: verify default collector
java -Xlog:gc=info -version 2>&1 | grep -i Using
Common misconceptions#
- Looking only at Java heap while ignoring native segments for card table, marking structures, etc.
- Ignoring +0.2% table overhead on tiny heaps with strict cgroup caps—JEP says usually insignificant, but measure.
- After JEP 523 ships, still assuming “embedded defaults to Serial” without updating monitoring and runbooks.


ORACLE / Lu S S =a has recognition noise).
Diagnostic path: from “which collector” to “did the table swap help”#
The path below targets JDK 26+ production or staging instances, ordered from lowest to highest cost.
Step 1 — Confirm collector and version
java -version
java -Xlog:gc=info -version
jcmd <pid> VM.flags | grep -E 'UseG1GC|UseSerialGC|UseParallelGC|MaxGCPauseMillis'
How to read output: the first line of -version should include 26 (or higher); -Xlog:gc=info at startup usually prints [gc] Using G1 or Using Serial, etc. If you did not pass -XX:+UseG1GC but see Serial, first check JEP 523 heuristics for < 1792 MB / single CPU—not “JEP 522 did not take effect.”
Step 2 — Watch refinement and pause for “dirty-card backlog”
java -Xlog:gc+refine=debug,gc+ergo=info,gc+pause=info -jar app.jar
# or for a running process (requires logging enabled at start or dynamic attach, deployment-dependent)
How to read output: if gc+refine shows refinement falling behind for a long time, or pause logs show card-scan share spiking, suspect refinement disabled or allocation + barrier dirty rate exceeding optimizer capacity—the same problem family JEP 522 addresses (“active table too large before pause”). If throughput is still poor after JDK 26, rule out non-G1 first, then very sparse reference writes (such workloads may not see JEP 522’s claimed 5–15% band).
Step 3 — JFR before/after upgrade
java -XX:StartFlightRecording=duration=300s,filename=before.jfr -jar app.jar
# same load after JDK 26 upgrade
java -XX:StartFlightRecording=duration=300s,filename=after.jfr -jar app.jar
How to read output: in JDK Mission Control or jfr print, compare jdk.GCPhasePause distribution, application-thread CPU, and GC subsystem CPU; mutator throughput gains often show as lower GC time share or higher business QPS at the same GC overhead, not a single pause number alone.
Step 4 — Native footprint (optional)
java -XX:NativeMemoryTracking=summary -jar app.jar
jcmd <pid> VM.native_memory summary scale=MB
How to read output: watch GC or Internal segments JDK 25 vs 26; dual tables theoretically add ~0.2% × 2 card storage, but auxiliary structure retirement may offset—trust the diff.
Step 5 — Container and small-memory heuristics (JEP 523 preview)
In a 1 vCPU, ≤1.5 GiB pod, start twice:
java -Xlog:gc=info -version
java -XX:+UseG1GC -Xlog:gc=info -version
Compare the two Using lines. Before JEP 523 lands, the first may still be Serial; if the business has validated G1, set explicit -XX:+UseG1GC in the image or JAVA_TOOL_OPTIONS—do not assume “JDK 26 upgrade means G1 everywhere automatically.” After JEP 523 ships, runbooks should read “G1 by default; tiny footprint may opt back to Serial.”
Production deployment notes#
| Dimension | Guidance |
|---|---|
| Version | JEP 522 applies only on JDK 26+ default G1 path; JDK 25 and below lack this dual-table implementation. |
| Flags | No mandatory new parameters for the behavior; do not run -XX:-G1UseConcRefinement long term in production without a documented triage reason. |
| Expectations | 5–15% comes from official heavily modify reference fields benchmarks; CPU-bound services with few reference writes may feel ~0%. |
| Memory | On tiny heaps with hard cgroup caps, measure with NMT; JEP says extra footprint is usually acceptable—not a contractual guarantee. |
| Default collector | Until JEP 523 ships, small configs may still be Serial; update monitoring and startup scripts that grep Using. |
| Fallback | If throughput is still insufficient, try -XX:+UseParallelGC (batch); tiny embedded may use -XX:+UseSerialGC—consistent with JEP 523 Non-Goals. |
| Risk | JEP 522 Risks acknowledges invasive changes may regress correctness or performance; gray JDK 26 with collector switch and heap-dump playbooks. |
| Observation cost | -Xlog:gc+refine=debug and heavy JFR profile settings add overhead—short diagnostic windows only, not always on. |
| Doc versions | Oracle links here use the Java 21 doc domain (as verified); JDK 26 behavior follows JEP 522 and the matching GA release notes—printed manual values may shift slightly at GA. |
For gray releases, fix three checks: (1) startup log confirms collector; (2) same-load JFR sample JDK 25/26 or “one week before/after upgrade”; (3) for reference-write-heavy services, inspect mutator CPU and gc+refine separately—do not reject throughput gains from global P99 pause alone.
References and further reading#
- JEP 522: G1 — improve throughput by reducing synchronization (JDK 26, Delivered)
- JEP 523: Always default to G1 when no collector is specified (Proposed to Target, Release 27)
- JEP 248: Server-class default G1 since JDK 9
- JEP 312: Thread-Local Handshakes (per-thread callbacks without a global VM safepoint)
- Oracle G1 tuning guide: regions, Remembered Set, 512 B cards
- Oracle: collector implementation and throughput/latency definitions
- Oracle: available collector selection overview
javacommand reference:-Xlog, collector flags,MaxGCPauseMillis, NMT, JFR- JEP 291: Deprecate CMS in JDK 9
- JEP 363: Remove CMS in JDK 14
- OpenJDK HotSpot G1 source tree (
src/hotspot/share/gc/g1) - Unified JVM Logging tag reference (
-Xlog:help) - Native Memory Tracking usage
- OpenJDK JDK 26 Release Notes (collector change entries)