
Post-Mortem JVM Crash Analysis: Read Cores with jcmd, Not a Second Toolchain#
When a HotSpot process exits on SIGSEGV or similar, operations teams usually have two kinds of artifacts: the JVM-written hs_err_pid*.log, and the operating-system core dump (on Windows, commonly a minidump). The former is a “crime-scene summary”; the latter is the full memory image. For years, seeing Java threads, heap, and class metadata inside a core often meant the separate Serviceability Agent (SA) or jhsdb path—while production troubleshooting already standardizes on jcmd subcommands. JEP 528: Post-Mortem Crash Analysis with jcmd aims to extend the same diagnostic commands to Linux cores / Windows post-mortem environments via process revival that maps crash-time VM state, rather than maintaining another Java-layer mirror implementation.
As of JDK 24/25, the Oracle jcmd manual Synopsis still describes attachment only to a live PID; syntax such as jcmd core.1234 …, -L, and -c follows the JEP text—verify against your actual JDK build before relying on it in production. JEP status is Candidate, target Release 27—capability boundaries below are grounded in the JEP and reproducible commands; talk-specific branch names and platform details are called out separately.
In live troubleshooting, JMX (JConsole, JMC), JFR, JDI/JVMTI, and unified JVM logging each cover monitoring, recording, and breakpoint scenarios; they depend on a process that is still running or reachable. Once the JVM is dead, most of those channels fail, leaving hs_err + core + native debuggers + SA/jhsdb. JEP 528 fills the Java-level view segment by aligning it with jcmd, not by inventing a fourth CLI dialect.
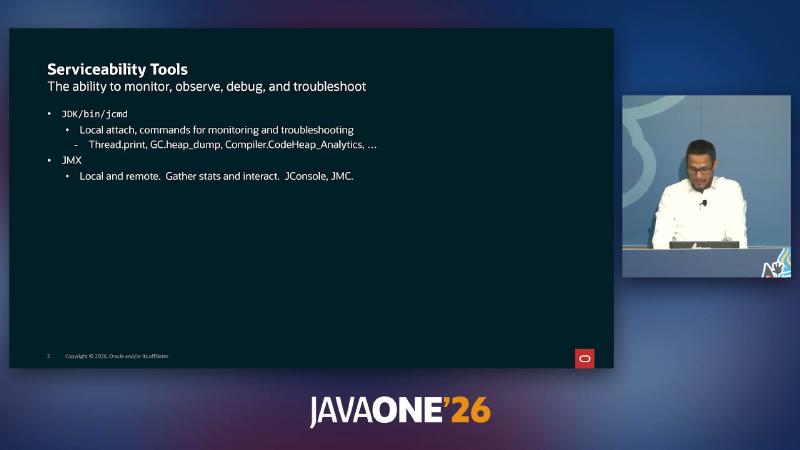
Figure: In the JDK serviceability tool family, jcmd handles local attach and subcommands such as Thread.print / GC.heap_dump—the post-mortem extension intends to keep this entry point.
Figure: Session title and JEP 528 entry—post-mortem diagnosis is positioned as an extension of jcmd, not a brand-new CLI.
Crash artifacts: what the text summary and memory image each cover#
Why#
In production incidents you need clues that are easy to forward and full-text searchable first; but hs_err cannot give you a traversable heap graph, nor can it replace questions like “was this object still referenced at the instant of the crash?”
Mechanism and constraints#
JEP 528 Motivation states the division clearly: on fatal error HotSpot writes hs_err_pidXXX.log (failing thread stack, loaded libraries, VM version, etc.); the OS saves the process address space as a core dump. The talk often says minidump on Windows; JEP prose still uses core dump generically and does not specify Windows file-format details (OS/operations domain).
How to#
# Collection (Linux example)
cp hs_err_pid*.log /case/run-20260517/
cp core.* /case/run-20260517/
ls -la /case/run-20260517/

# Target host: allow core generation (bake into runbook per distro)
ulimit -c unlimited
Common misconceptions#
Closing the ticket after keeping only hs_err—many Metaspace / heap / lock issues need GC.* / VM.* on the core; conversely, copying only the core without hs_err drops JVM-reported error type, compiler threads, VM arguments, and other context.
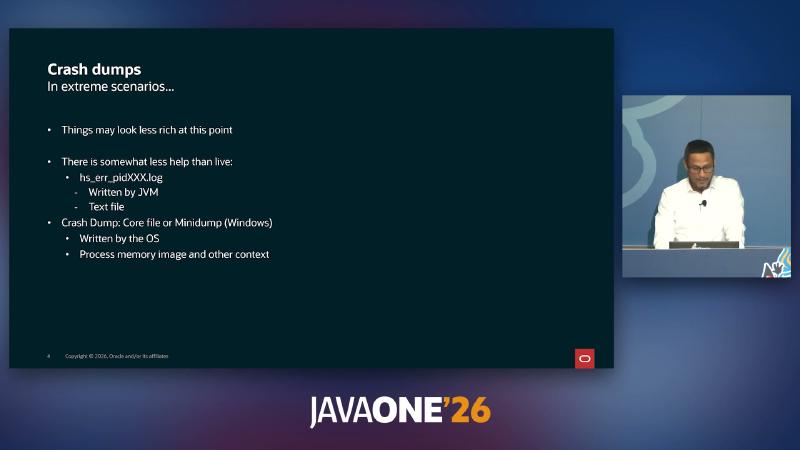
Figure: hs_err is a text summary; core/minidump is an OS-level memory image—post-mortem analysis usually needs both.
Native debuggers do not reach Java semantics#
Why#
gdb / WinDbg excel at libraries, symbols, and native stacks; when a crash happens near JIT code, the interpreter, or GC barriers, engineers need which Java thread, who holds the lock, what the heap top looks like.
Mechanism and constraints#
The JEP is explicit: analyzing a core with gdb cannot interpret JVM internals directly as application-level Java state; decoding an oop’s class requires hand-reading object headers (see JEP 450 object headers). JEP Alternatives also stress: native debuggers remain a necessary part of JDK troubleshooting—jcmd is not meant to replace arbitrary address inspection in gdb.
How to#
gdb /path/to/java core.1852094
# Same core, JEP target syntax (GA builds may not support yet):
/path/to/jdk/bin/jcmd core.1852094 Thread.print
Common misconceptions#
Obsessing over “missing symbols” on ?? () frames while ignoring the Java stack; or expecting WinDbg alone to show java.lang.Thread.State—that belongs to the JVM diagnostic layer.
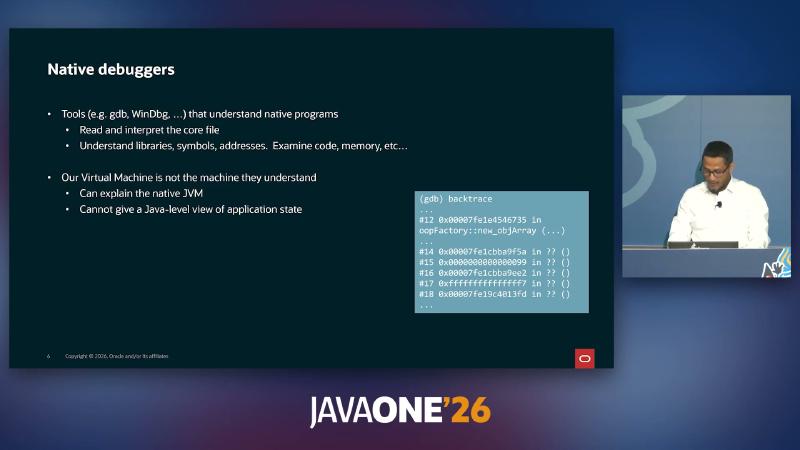
Figure: JVM C++ symbols may appear in the native stack; JIT/interpreter paths often resolve to ?? () with no direct Java method mapping.
From dual SA maintenance to a single jcmd entry point#
Why#
In HotSpot Serviceability, SA can expose the Java heap and HotSpot structures on running processes and cores, but JEP Motivation calls the implementation brittle and dated, requiring ongoing maintenance as the VM evolves. In live scenarios, jcmd already carries Thread.print, GC.heap_dump, and more via the Attach API; maintaining a parallel jhsdb + SA implementation post-mortem is costly and drifts easily.
Mechanism and constraints (partially speaker opinion)#
The talk mentions on the order of ~130k lines of SA mirror sync with HotSpot source, insufficient ZGC support, and similar—the JEP does not give line counts or ZGC details. JEP Goals focus on jcmd, reducing maintenance on jhsdb/SA, not immediately removing existing tools.
How to (unified entry illustration)#
# Live JVM (supported in GA)
jcmd <pid> Thread.print

# Post-mortem (JEP 528 target)
jcmd core.1852094 Thread.print
Common misconceptions#
Assuming jstack/jmap are already deprecated before the JEP ships—they still appear widely in older runbooks; plan post-mortem migration to jcmd + core rather than mixing multiple script stacks with inconsistent JDK versions.
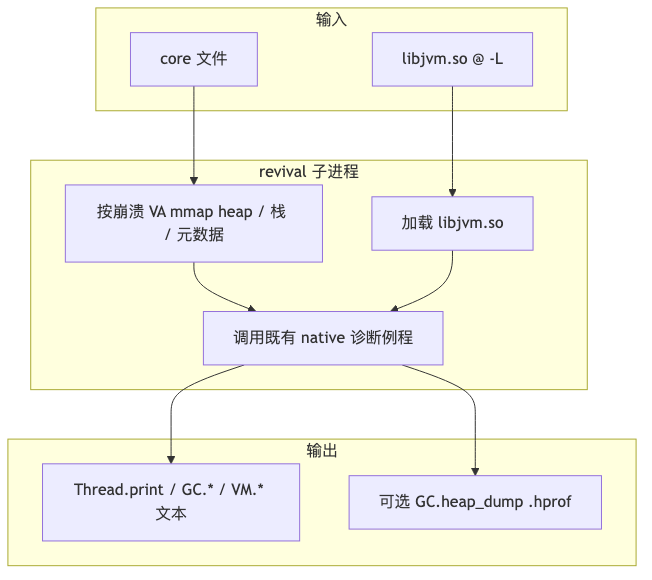
Core revival: map memory, reuse existing DCmds#
Why#
If post-mortem diagnosis rewrote a “Java mirror,” it would couple tightly to HotSpot internals; the JEP chooses child-process revival: map the core at original virtual addresses so pointers stay valid, then invoke the same native diagnostic implementations as live Attach.
Mechanism and constraints#
Reviving a core dump specifies:
jcmdstarts a child process, mmaps the core, restoring Java heap, metaspace, thread stacks, and more;- Loads the crash-time
libjvm.soat the original address (Windows:jvm.dllin talk wording); - Does not execute Java code or trigger GC; may call native JVM functions that interpret structures;
- Analysis needs only core + crashed JVM binary; not the full set of application
.sofiles (friendlier for cross-machine transfer).
ExecuteDiagnosticCommand in OpenJDK jmm.h matches the live path; the slide’s DCmd::parse_and_execute is implementation wording, not a JEP normative symbol.
How to (sandbox experimental build; branch name not verified on public openjdk/jdk, speaker wording)#
# Requires a JDK build that contains the JEP 528 implementation
build/*/images/jdk/bin/jcmd -L /prod/jdk/lib/server/libjvm.so ./core.1852094 Thread.print
Common misconceptions#
Thinking revival keeps business threads running—the child is a read-only replay of the memory layout; live-state commands such as GC.run, JFR.start on a core are out of scope per JEP Non-Goals / Future Work (Java-implemented DCmds are incompatible with revival).
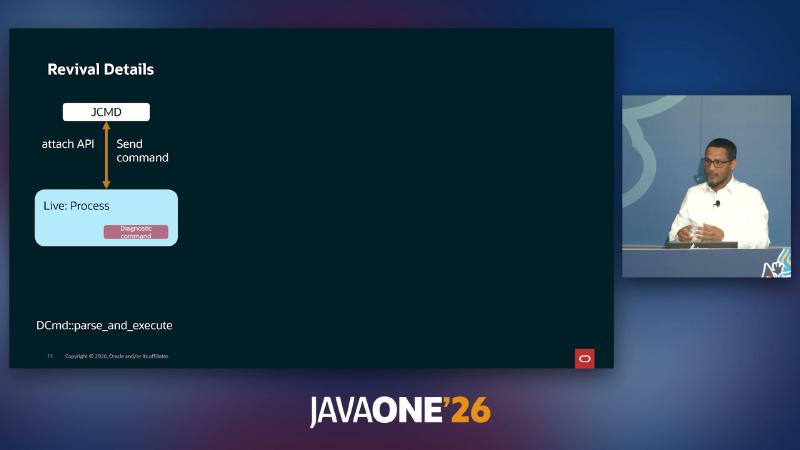
Figure: On the live path, jcmd → Attach API → DCmd::parse_and_execute; post-mortem sends the same class of commands to the VM image in a revival child.
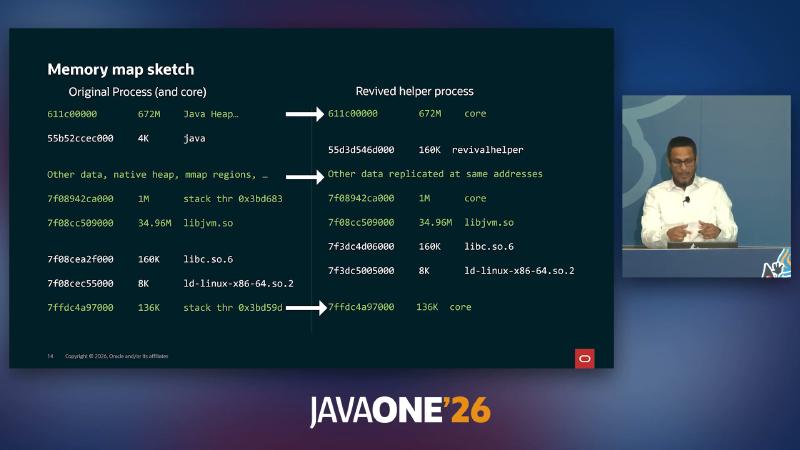
Figure: The helper maps Java heap, thread stacks, and more from the core at crash VAs; the helper’s own libc may sit at different addresses than production without breaking JVM structure interpretation.
Thread.print: locks and safepoint trustworthiness#
Why#
Post-mortem, the first questions are often who blocks whom and where the crashing thread is stuck.
Mechanism and constraints#
The JEP lists Thread.print among 26 post-mortem commands (versus about 57 live). Output includes java.lang.Thread.State, BLOCKED (on object monitor), _at_safepoint, and similar fields of the same kind as a live thread dump.
How to#
jcmd core.1852094 Thread.print > threads-at-crash.txt
# Compare with a live capture before the incident (if any)
diff threads-live.txt threads-at-crash.txt
Common misconceptions#
Treating cpu=0.95ms in post-mortem output as performance data—speaker opinion: for a dead process CPU time is meaningless; JEP sample lines still include cpu=, and the spec does not define semantics on core—ignore that field in analysis.
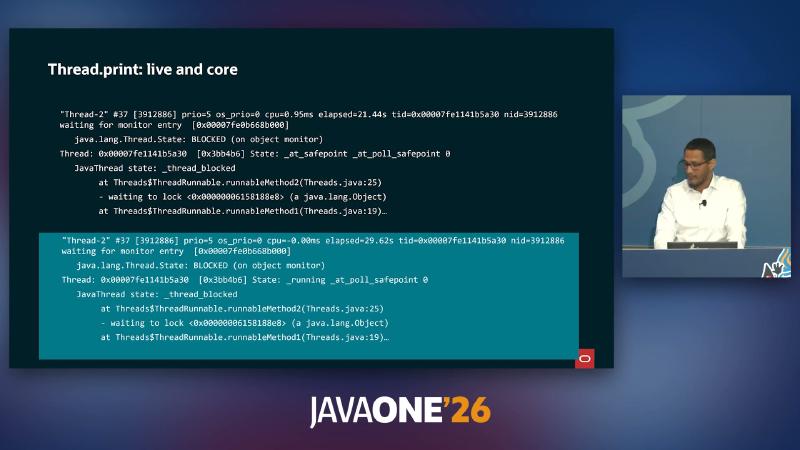
Figure: In jcmd core.1852094 Thread.print, Thread-2 is BLOCKED (on object monitor), HotSpot side _at_safepoint, stack top Threads$ThreadRunnable.runnableMethod2.
Heap diagnostics: GC.heap_info, GC.heap_dump, GC.class_histogram#
Heap layout and hprof export#
Why#
When hs_err heap addresses had to be stitched by hand, exporting .hprof often relied on SA scripts; unifying on jcmd reduces runbook fragmentation.
Mechanism and constraints#
The JEP post-mortem list includes GC.heap_info, GC.heap_dump. GA manual semantics for live: GC.heap_info reports layout; GC.heap_dump writes .hprof (filename, -all, and other options). Whether every option combination works on core is implementation-defined.
How to#
jcmd ./core.1852094 GC.heap_info
jcmd ./core.1852094 GC.heap_dump /tmp/postmortem.hprof
Common misconceptions#
Assuming GC.heap_dump triggers GC—in post-mortem revival no GC occurs; the export is a heap graph frozen at the crash instant.
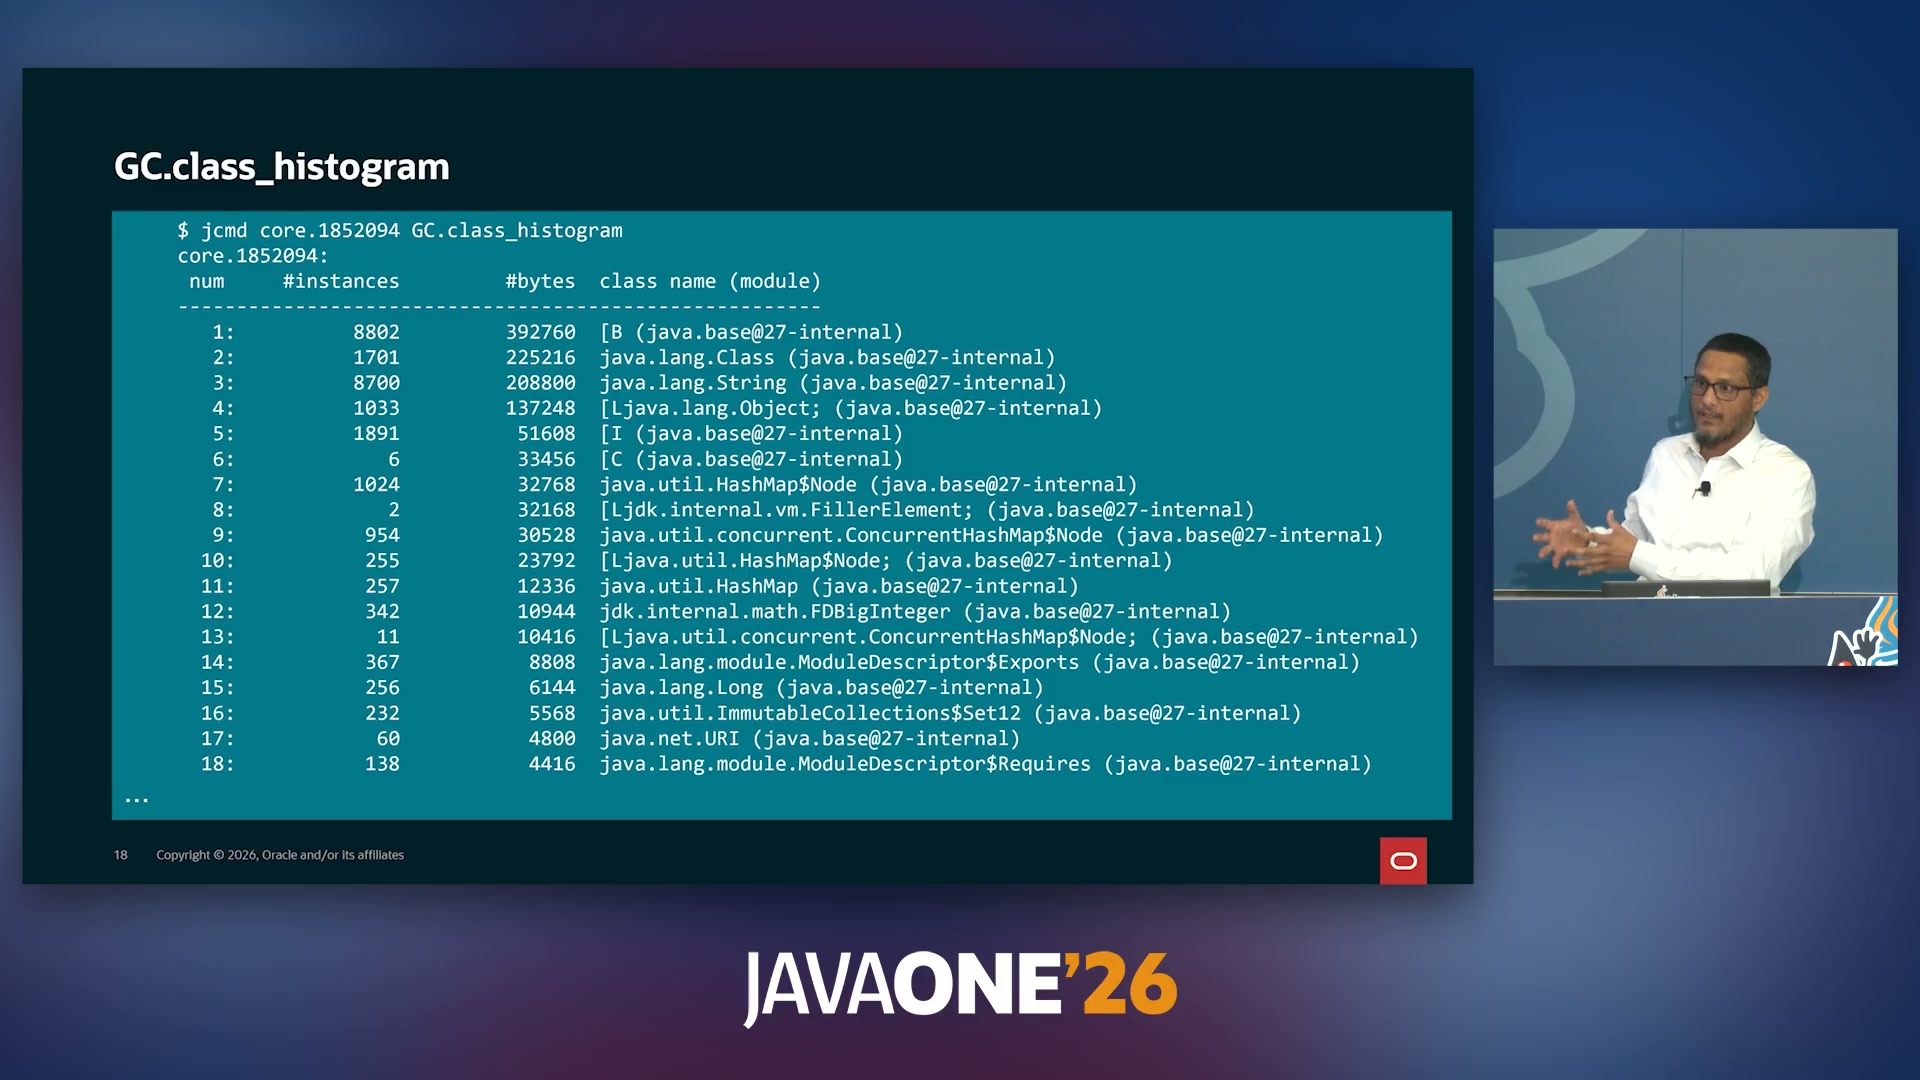
Class histogram#
Why#
You need a quick read on whether byte[] or a business class was abnormally large at crash time without opening MAT immediately.
Mechanism and constraints#
GC.class_histogram is marked Impact: High in GA (depends on heap size); post-mortem output is a crash-site snapshot; #instances / #bytes columns match live format. Module suffixes like (java.base@27-internal) come from the demo JDK, not fixed normative strings.
How to#
jcmd core.1852094 GC.class_histogram | head -40
Common misconceptions#
Using the histogram for reference-chain analysis—it only aggregates by class; reference chains still need a heap dump or JEP Future Work arbitrary object inspection (the talk mentions a planned VM.inspect; the JEP does not use that symbol name).
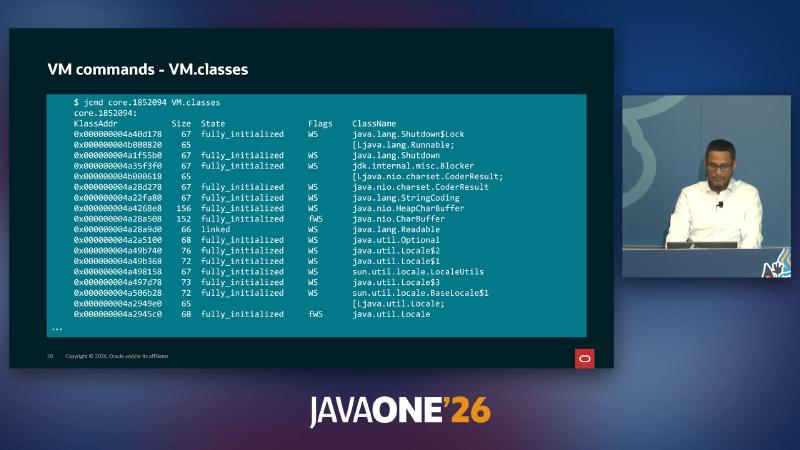
Figure: VM.classes header KlassAddr Size State Flags ClassName; sample rows fully_initialized, java.lang.Shutdown, jdk.internal.misc.Blocker, and more.
Metaspace usage#
Why#
For Metaspace OOME or class space pressure crashes, verify used / committed / reserved and shared classes post-mortem.
Mechanism and constraints#
JEP includes VM.metaspace; the manual lists basic, show-loaders, by-chunktype, and other options. Default output granularity is implementation-defined.
How to#
jcmd core.1852094 VM.metaspace > meta-at-crash.txt
Common misconceptions#
Watching only used and ignoring reserved—when cross-checking hs_err, the two may tell different stories about commit vs reserve; treat scannable VM.metaspace as primary and hs_err as cross-validation.
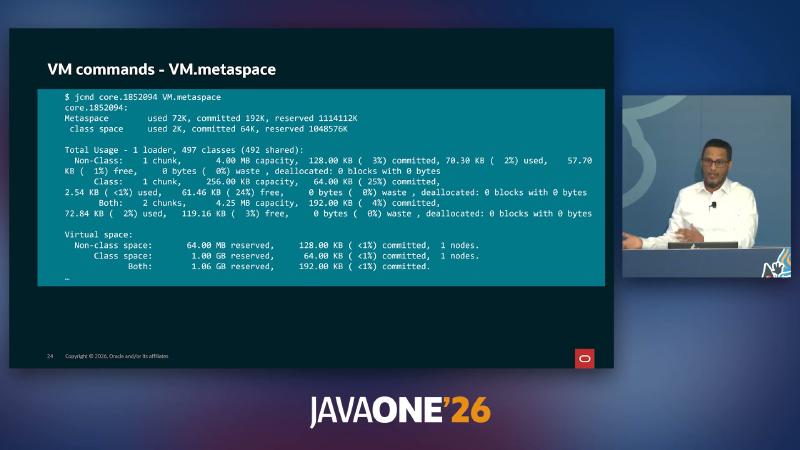
Figure: Metaspace used 72K, committed 192K, reserved 1114112K; 497 classes (492 shared) and chunk-level Non-Class / Class breakdown.
CLI: -L, -c, and help matching rules#
Why#
Cores are often copied to a laptop; jcmd version may differ from the crashed JVM version, but libjvm.so must align.
Mechanism and constraints#
(JEP post-mortem environments):
-L /path/to/libjvm.so: point at the crashed JVM binary;-c ./core: argument is the core file, avoiding clash with a main class name;- the analyzer’s
jcmdmay differ in JDK version from the crash, but must load the JVM binary from the crash; - post-mortem environment must match crash site OS and CPU architecture.
Speaker opinion: jcmd <core> help lists only the core-supported subset (JEP describes “26 of 57” for scope, does not define a separate help-filter algorithm); mapping libc.so consistent with production on OL9/RHEL9 can lower revival failure rates—not JEP normative text.
How to#
jcmd -c ./core.1852094 help
jcmd -L /opt/jdk-prod/lib/server/libjvm.so ./core.1852094 Thread.print
Common misconceptions#
A laptop with JDK 21 jcmd analyzing a JDK 17 core without -L pointing at 17’s libjvm.so; or copying the core to a different architecture machine.
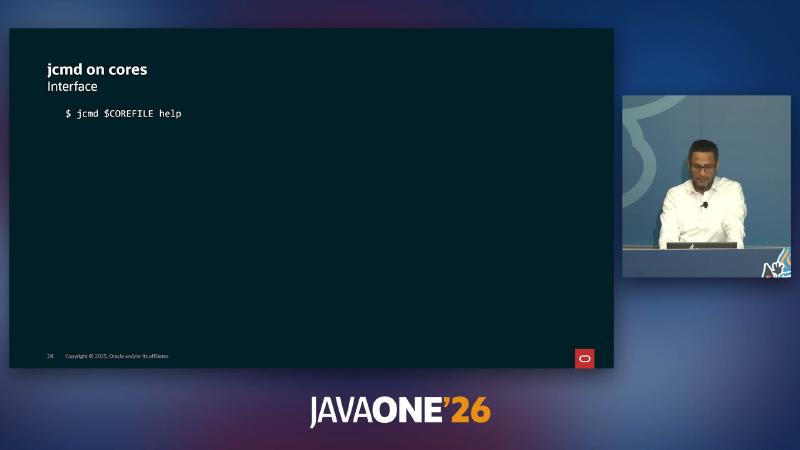
Figure: Post-mortem interface extends from jcmd <pid> to running help and subcommands against $COREFILE.
Capability boundaries and delivery timeline#
Why#
Avoid over-promising not-yet-GA features, and avoid using jcmd to replace all native debugging.
Mechanism and constraints#
| Topic | JEP / fact | Speaker supplement |
|---|---|---|
vs gdb | Non-Goals: cannot replace native debuggers | WinDbg scenario analogy |
| Live-state commands | Post-mortem no JFR.start/JFR.stop, etc. | GC.run also not in post-mortem list |
| Arbitrary object inspection | Future Work: inspect arbitrary Java objects | Spoken VM.inspect, no JDK 27 schedule commitment |
| Platforms | Goals: Linux + Windows; Future Work: macOS | Refined to x64 / AArch64 triplets |
| Status | Candidate, Release 27, JDK-8328351 | Sandbox branch jcmd_core_process_revival not found on public GitHub |
How to (boundary self-check)#
jcmd core.1852094 help | rg -i jfr # expect no JFR.start/stop
Common misconceptions#
Looking for JFR.start on a core; or expecting jcmd to inspect arbitrary address objects—today use gdb/jhsdb until Future Work lands.
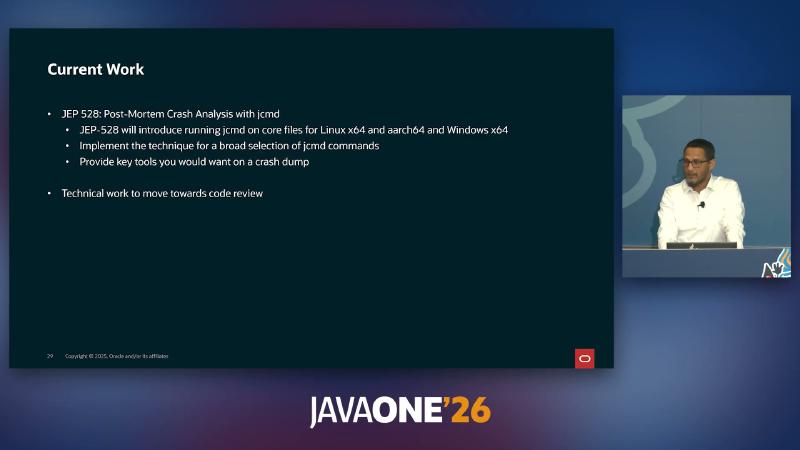
Figure: JEP 528 brings a broad selection of jcmd commands to Linux x64 / Linux aarch64 / Windows x64; engineering status is moving toward code review (slide wording).
Suggested post-mortem investigation order#
If you maintain a HotSpot crash runbook, once JEP 528 is available you can narrow the evidence chain “cheap first, heavy later”:
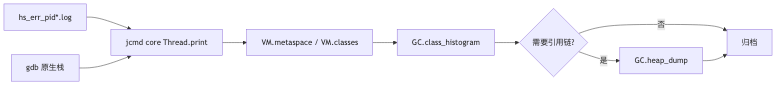
- Read
hs_err: signal, problem thread, VM version,-XX:flags. Thread.print: locks, Java stack, safepoint.VM.metaspace/VM.classes/VM.classloader_stats: metaspace and class loaders.GC.class_histogram: whether object composition looks abnormal.GC.heap_dumpwhen you need MAT.- VM-native defects or addresses
jcmdcannot cover →gdb.
References and further reading#
- JEP 528: Post-Mortem Crash Analysis with jcmd — authoritative post-mortem
jcmdscope, revival mechanism, and list of 26 commands - JEP 528 — Reviving a core dump — child-process mapping, no Java execution/GC
- JEP 528 — jcmd in post-mortem environments —
-L,-c, cross-version and OS/CPU constraints - JEP 528 — Non-Goals — does not replace
gdb, does not run Java code - JEP 528 — Future Work — arbitrary object inspection, class dumping, boundaries with JFR
- JDK-8328351 — JEP 528 tracking issue
- Oracle JDK 24
jcmdmanual — live subcommand semantics (Thread.print,GC.*,VM.*) - Oracle JDK 24
jhsdbmanual — existing core analysis entry for comparison - HotSpot Serviceability — Serviceability Agent and tool ecosystem
- HotSpot Serviceability — Serviceability Agent — SA capabilities and maintenance background
- JEP 450: Compact Object Headers — object header reference when hand-decoding oops in native debuggers
- OpenJDK
jmm.h— ExecuteDiagnosticCommand — diagnostic command dispatch on the Attach path - Wikipedia: Core dump — OS-level core concept
- Java SE Troubleshooting Guide — Oracle troubleshooting overview
- Unified JVM Logging — runtime logging complementary to post-mortem analysis


