

JVM and Spring Boot Observability: How the Three Signals Actually Connect#
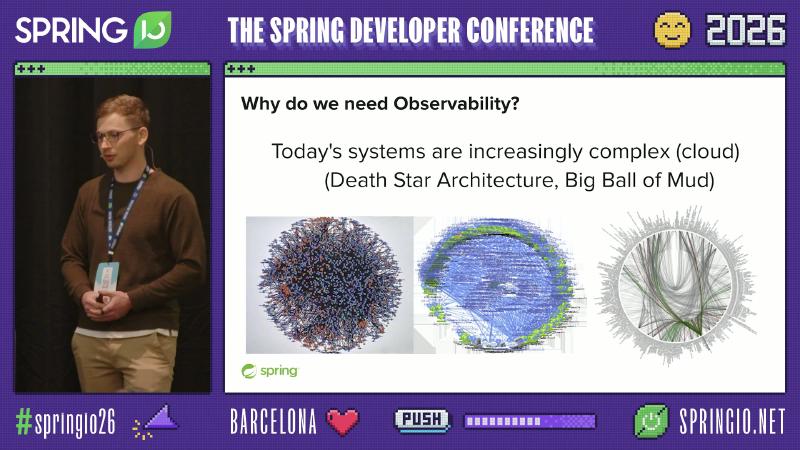
The most common frustration in production is not “no monitoring,” but a lone HTTP 500 in the UI while logs mix in downstream 404s and metric curves fail to show which call chain is flapping. Once cloud-native and microservices stretch the dependency graph into “Death Star” density, in-process stacks or a single APM panel are often insufficient: you need metrics to answer “how bad is it and what is the blast radius,” logs to preserve business semantics and stack traces, and traces to reconstruct cross-hop timing and status codes.
Micrometer and Spring Boot Observability fold the three signals into one Observation pipeline; the Grafana stack (Loki / Prometheus / Tempo) welds the same request back together in troubleshooting UIs. This article does not replay the conference timeline; it keeps mechanisms and operational takeaways you can carry to Boot 2.7→4. The sections follow why → mechanism → how → pitfalls, covering dependency evolution from Boot 2.7→4 and the instrumentation model. The demo topology comes from the Teahouse sample (public repo URL not verified); Grafana datasource linking is a reproducible pattern, not the only on-site wiring.
Why you need a multi-service sample that can be stitched together#
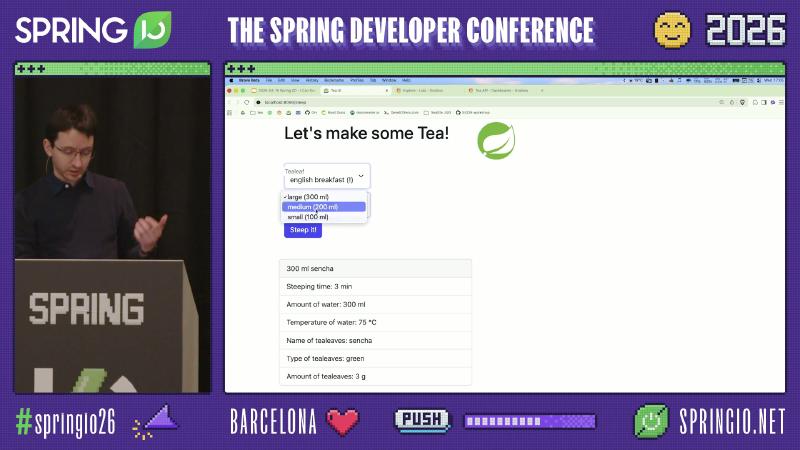
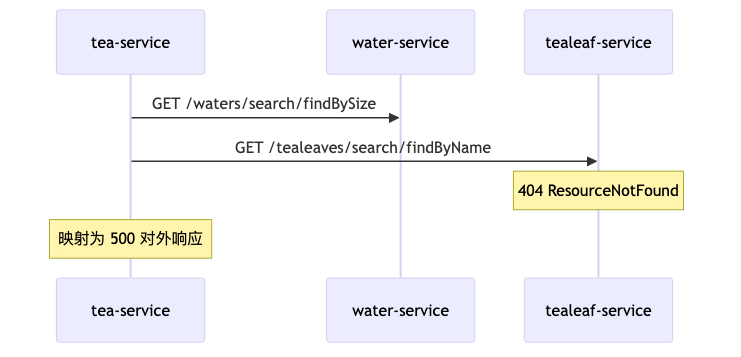
A single-process demo rarely surfaces cross-service traces, downstream 404 wrapped as upstream 500, or whether JDBC or HTTP child spans are slower. Teahouse runs tea-service (8090) over HTTP to water-service (8091) and tealeaf-service (8092), each with JDBC; the user triggers the full chain from the UI on 8099 by clicking “make tea.”
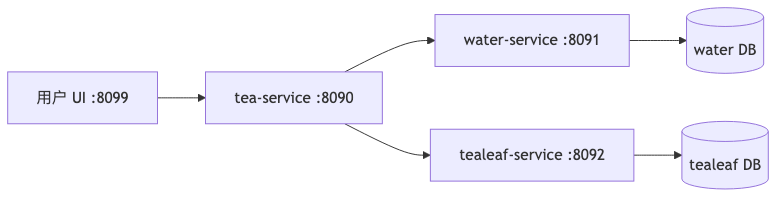
Mechanism: Each service is an independent process with its own spring.application.name; labels such as application=tea-service in observability tags usually come from the application name, not a framework hard-coded default (see management.metrics.tags.*).
How: Run at least three Boot apps locally and deploy an OTLP/Zipkin receiver, Prometheus scrape, and Loki push or agent. Calling GET /tea/{name} with combinations such as english breakfast reliably reproduces business errors like ResourceNotFoundException (log package org.example.teahouse.core.error is on-site OCR evidence, not a Spring product package).
Pitfall: Treating “curl works” as “we can troubleshoot,” or mixing application and service.name tags without a unified spring.application.name, so Loki and Prometheus filters no longer point at the same service.
Troubleshooting order: suspect in logs → narrow with metrics → root-cause in traces#
A common industry order (Spring docs describe the three signals but do not mandate this sequence): lock application=tea-service ERROR lines in Loki, use aggregated metrics to see whether it is a local blip or a global incident, then use distributed tracing to reconstruct the call chain and the true HTTP status at each hop.
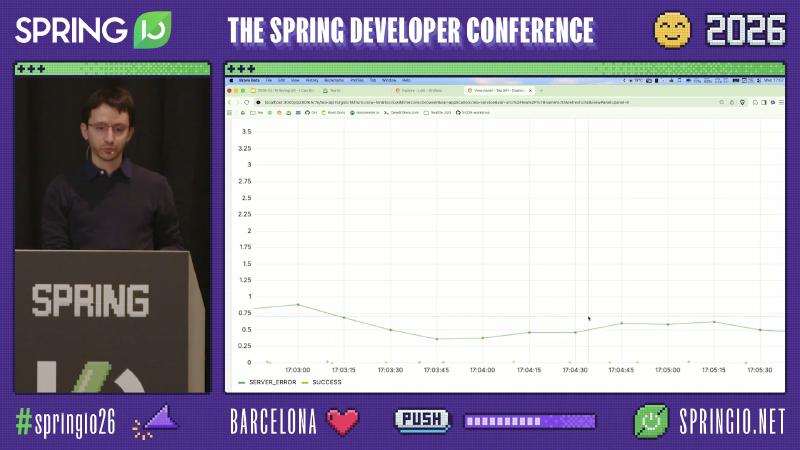
Micrometer’s default HTTP server observation name is http.server.requests; after export to Prometheus you often see http_server_requests_seconds_count. The outcome tag comes from HttpStatus.Series: 2xx is SUCCESS, 5xx series is SERVER_ERROR (DefaultServerRequestObservationConvention source).
sum(rate(http_server_requests_seconds_count{
  application="tea-service",
  outcome="SERVER_ERROR"
}[$__rate_interval]))
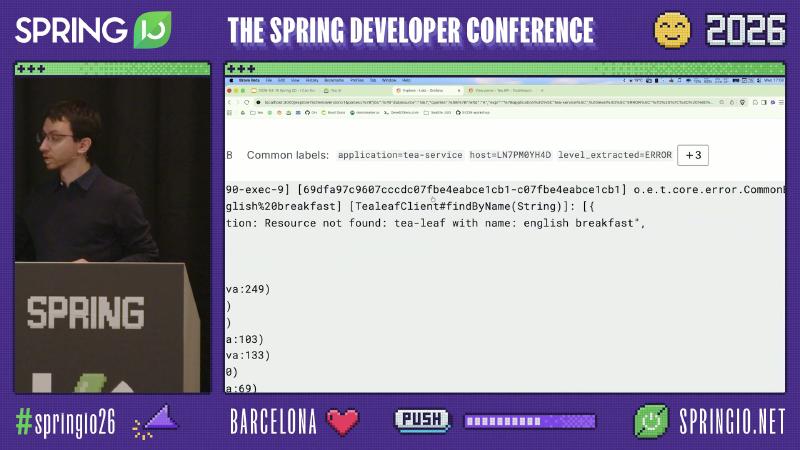
Typical ERROR lines include [tea-service], [http-nio-8090-exec-*], and a trace fragment in brackets (e.g. 69dfa97c9607cccdc@7fbe4eabce1cb1), plus a Feign/HTTP client method name such as [TealeafClient#findByName]. Paste that ID into Tempo Explore’s queryType":"traceql" query box to move from “suspect tea-service” to “see tealeaf returned 404 first.”
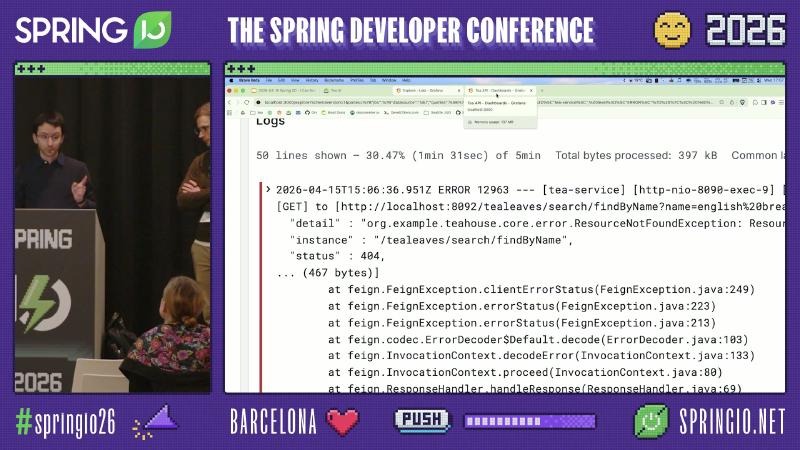
How (minimal Loki filter pattern): {application="tea-service"} |= "ERROR" or level_extracted="ERROR" (label names depend on the pipeline; the demo stack used level_extracted). Align the time window with Prometheus [$__rate_interval] to avoid the illusion of “logs show errors but the curve is flat.”
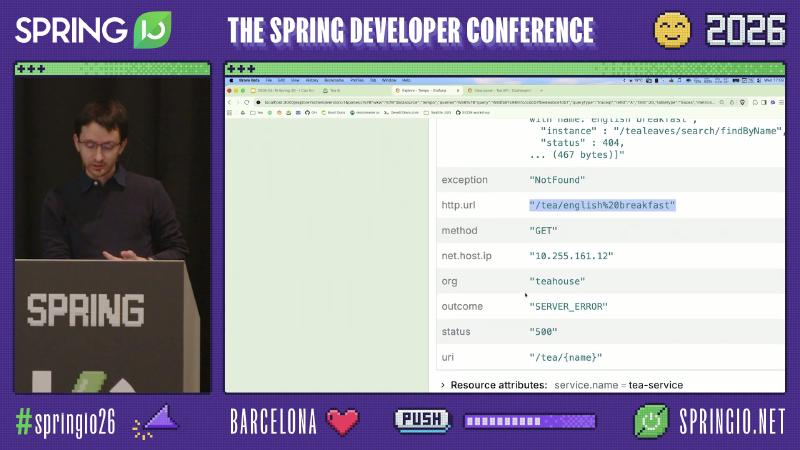
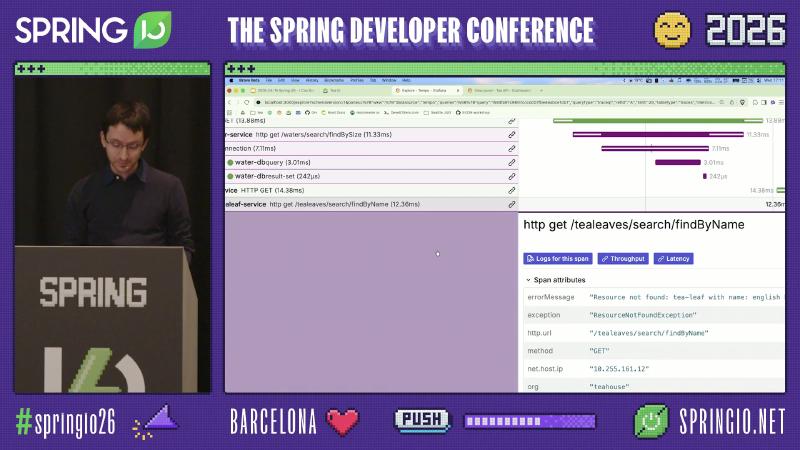
Pitfall: Seeing tea-service return 500 and changing tea-service. Speaker’s view: tealeaf-service can correctly return 404 while tea-service maps the client error to 500—an application error-handling anti-pattern, not a framework bug; spans may show non-standard status: 599 alongside outcome: SERVER_ERROR (demo/OCR on-site values, not HTTP standard). The fix is to propagate or preserve downstream 4xx and distinguish CLIENT_ERROR from SERVER_ERROR in metrics, not to disable tracing.
Log correlation: write the trace ID into every line#
Why: With many replicas and services, timestamps and message text alone cannot align a single user request.
Mechanism: Spring Boot Tracing — Logging Correlation states that with Micrometer Tracing, correlation IDs are included in logs by default; MDC keys are traceId and spanId, and the format is adjustable via logging.pattern.correlation.
logging:
  pattern:
    correlation: "[${spring.application.name:},%X{traceId:-},%X{spanId:-}] "
  include-application-name: false  # avoid duplicating app name when using correlation
Propagation defaults align with W3C traceparent / B3 (depending on the bridge); if downstream water-service and tealeaf-service also have tracing on the classpath, logs across services share traceId under the same trace, while spanId changes per current span.
How: When upgrading from Sleuth, follow Logging Correlation IDs to put %X{traceId} in logging.pattern.level or the correlation block; for structured JSON logs, promote traceId/spanId to fields for Loki | json parsing.
Pitfall: Assuming “Actuator is on” means “logs carry trace”—you need tracing on the classpath plus sampling/export config; without an exporter you may still see IDs in logs but spans may not reach Tempo (see the tracing dependencies section). Another pitfall is logging only traceId without spanId, which still makes parallel span scenarios hard to align to a single sub-operation.
Distributed tracing: see HTTP and JDBC clearly in Tempo#
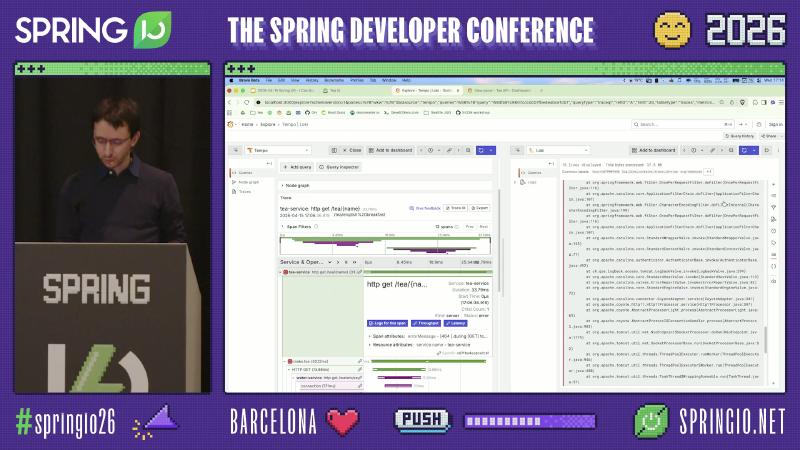
In Grafana Explore, select the Tempo datasource and open tea-service: http get /tea/{name} via TraceQL or trace ID. You can expand child spans such as make.tea, downstream HTTP, and water-dbquery / tealeaf-dbresult-set, and compare http.url, exception, and status per hop.
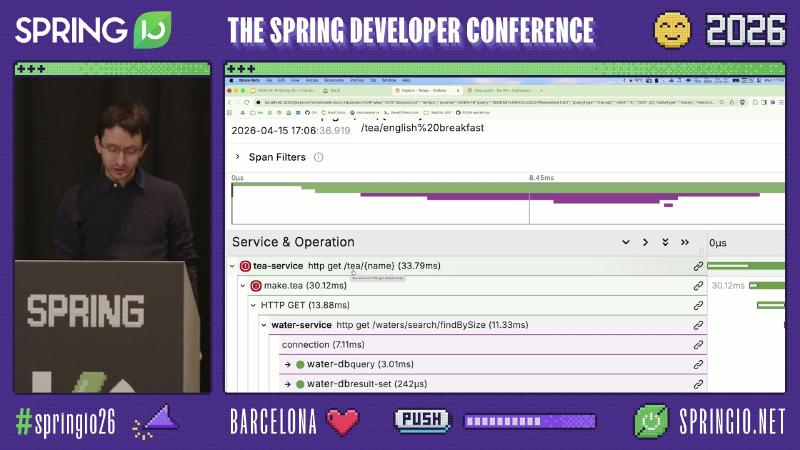
Grafana Tempo Node graph gives a quick fan-out view; the span tree shows names like connection, water-dbquery, tealeaf-dbresult-set from JDBC and pool observability (often via datasource-micrometer and similar integrations—specific span names are from the demo app). Span attributes such as db.name=tealeaf-db tie slow queries to a database instance.
How: Boot 3+ typically uses spring-boot-starter-actuator + micrometer-tracing-bridge-brave (or OTel bridge) + Zipkin/OTLP reporter; Boot 4 can use spring-boot-starter-opentelemetry or spring-boot-starter-zipkin, with management.opentelemetry.tracing.export.otlp.* or management.tracing.export.zipkin.*. Example sampling:
management:
  tracing:
    sampling:
      probability: 1.0   # demo environment; lower in production
Pitfall: Staring only at root span duration—under make.tea (~30ms order of magnitude, demo OCR) parallel/serial HTTP and DB child spans expose whether the water or tealeaf database is slow. Another pitfall is inferring all downstream hops are 5xx from a 500 in the UI—read http.status_code on each client span.
Traces → logs: pull the full chain by trace ID#
Grafana docs explain that when you click “Logs for this span,” filtering is by trace ID, not the current span ID; both Tempo and Loki need configuration (e.g. tracesToLogsV2, derived fields, ${__trace.traceId}).
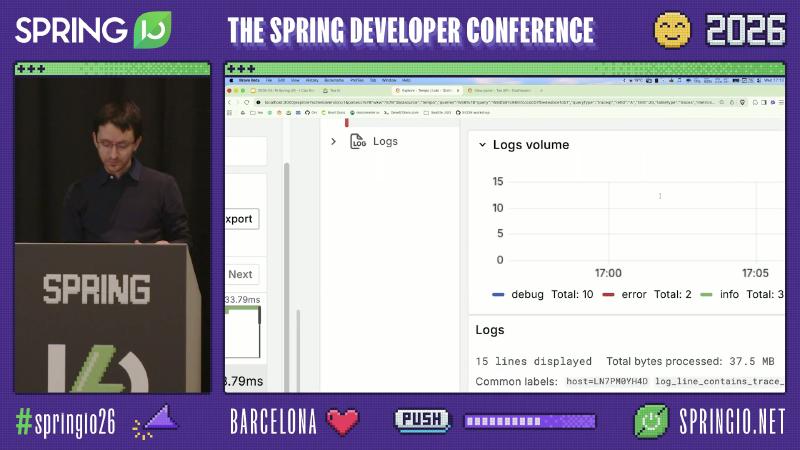
How: Configure tracesToLogsV2 in the Tempo datasource YAML and derived fields in Loki pointing at Tempo; log lines must contain the trace ID string (or an agent must parse JSON fields). The demo Explore view also showed log volume stats such as debug Total:10 and error Total: 2, useful to tell single-service noise from errors across the whole chain.
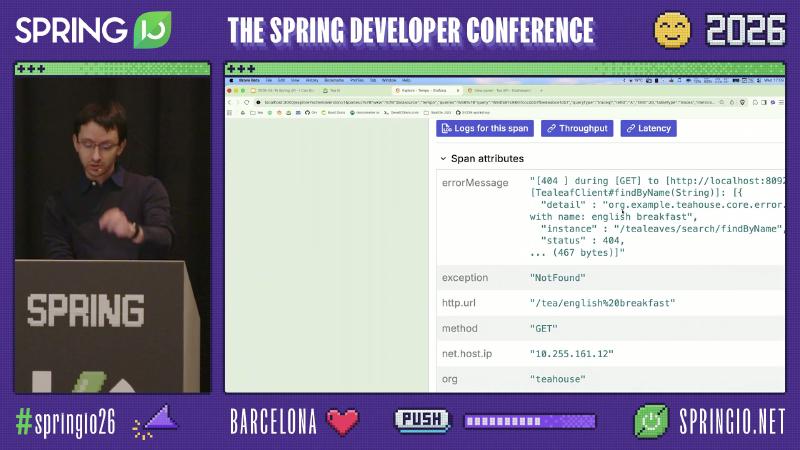
Pitfall: UI text says “span” so you assume only the current span’s logs—actually the full trace’s logs across participating services; without linking, the button is disabled or empty (on-site demo wiring; production needs your own). Do not filter Loki only by container name without trace ID, or replicas will still cross-wire.
Metrics ↔ traces: low-cardinality tags and exemplars#
Spring Boot Observability: low-cardinality keys go to both metrics and traces; high-cardinality values (e.g. user input) go only to traces. Spans and PromQL can then align on dimensions such as application, outcome, and exception.
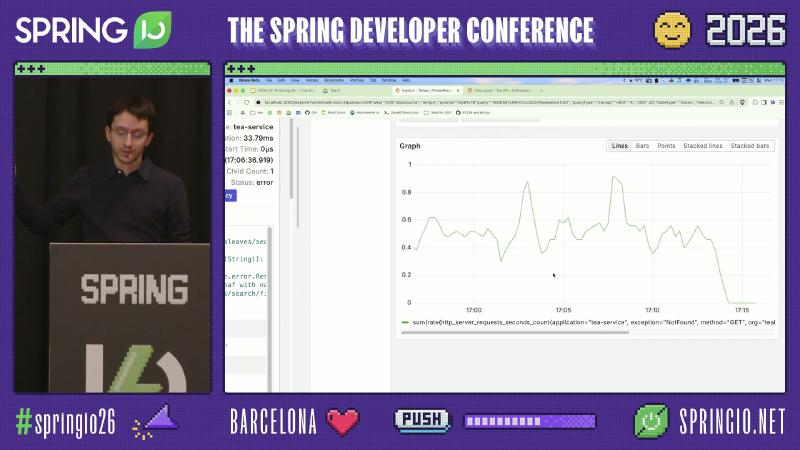
Exemplars attach a trace ID to a point on an aggregated curve so Grafana can jump back to Tempo. Prometheus must enable exemplar storage; Micrometer can supply SpanContext when integrated with tracing (Metrics — Prometheus Exemplars).
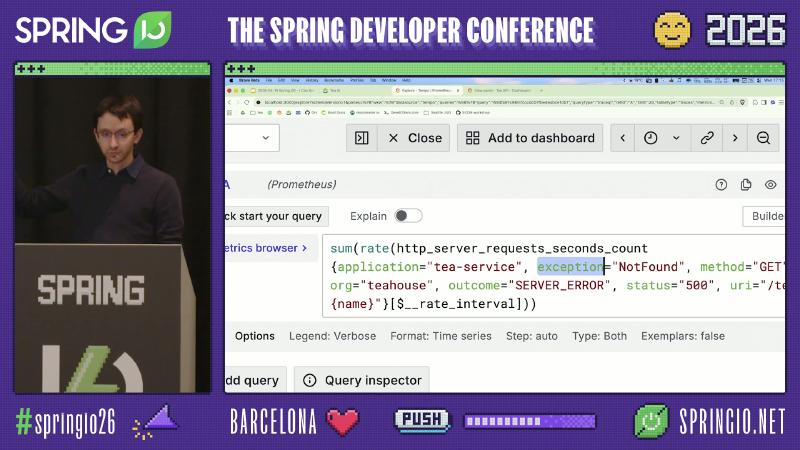
sum(rate(http_server_requests_seconds_count{
  application="tea-service",
  exception="NotFound",
  method="GET"
}[$__rate_interval]))
The prerequisite chain for exemplar drill-back can be split into three layers (missing any layer breaks “from curve point into Tempo” in the demo):
- Application: Micrometer Prometheus registry exports exemplars and tracing provides
SpanContext(Boot docs Prometheus Exemplars). - Prometheus: Enable exemplar storage and scrape OpenMetrics format (feature flag docs).
- Grafana: Link Prometheus and Tempo datasources and enable Exemplars on the panel (the demo panel once showed
Exemplars: false; you must turn it on for drill-down).
Unverified boundary: The demo stack used Prometheus exemplars; the roadmap mentions Boot 4.1 / Micrometer 1.17 strengthening exemplars on the OTLP registry (1.17.0-RC1 release notes are RC-level only). Whether exception=NotFound appears by default on http.server.requests depends on whether the error is recorded on the Observation as a low-cardinality key—this article does not verify default tags for every exception type.
Logging stack: what Boot 2 / 3 / 4 share and optional enhancements#
spring-boot-starter-logging (SLF4J + Logback) is consistent across major versions; Logging features document Logback as default. Swapping in spring-boot-starter-log4j2, Logbook, or Tomcat access logs is optional:
server:
  tomcat:
    accesslog:
      enabled: true
Pitfall: Rewriting the logging API on every Boot major upgrade—usually you only need to verify correlation and appenders; GC logs, Jetty access logs, etc. are separate operational choices. Access logs capture the edge entry (raw requests Tomcat sees) and complement application logs with trace correlation; they do not replace traceId in MDC—align via timestamps and X-Forwarded-* when needed, or inject trace headers uniformly from a service mesh.
Micrometer metrics: dimensional model and pluggable registries#
Micrometer offers backend-agnostic Timer/Counter APIs exported via micrometer-registry-prometheus and others. Boot 4 also offers spring-boot-starter-micrometer-metrics (whether this avoids pulling full Actuator web endpoints requires checking your dependency tree—partially verified in source notes).
<dependency>
  <groupId>org.springframework.boot</groupId>
  <artifactId>spring-boot-starter-actuator</artifactId>
</dependency>
<dependency>
  <groupId>io.micrometer</groupId>
  <artifactId>micrometer-registry-prometheus</artifactId>
</dependency>
Pitfall: Searching Prometheus for http_server_requests while forgetting the Micrometer name is http.server.requests—that is export naming conversion, not lost instrumentation.
Tracing dependency evolution: Sleuth, Micrometer Tracing, Boot 4 starters#
| Era | Typical stack |
|---|---|
| Boot 2.7 + Spring Cloud | Spring Cloud Sleuth (core moved to Micrometer Tracing) |
| Boot 3 | Actuator + micrometer-tracing-bridge-brave | bridge-otel + Zipkin/OTLP reporter |
| Boot 4 | spring-boot-starter-zipkin or spring-boot-starter-opentelemetry as a single starter |
The migration guide (Wiki) is still worth comparing package and config prefix changes.
Upgrade checklist (avoid only bumping the Boot version):
- Starters:
micrometer-tracing-bridge-brave+zipkin-reporter-brave→spring-boot-starter-zipkin; or OTel bridge + OTLP exporter →spring-boot-starter-opentelemetry. - Config prefixes: do not mix
management.tracing.export.zipkin.*andmanagement.opentelemetry.tracing.export.otlp.*without removing old keys. - Observation integration:
TracingAwareMeterObservationHandlerstill binds trace context into metrics/exemplars per the docs.
Speaker’s view (not verified line-by-line in Boot 4 official docs): OTel Logback/Log4j appenders remain unstable on the JVM; Boot 4 has no full OTel logging starter. Without an exporter, trace/span IDs may still appear in logs but there is no span in the backend—exact behavior depends on the tracing starter and sampling (management.tracing.sampling.probability).
Observation API: instrument once, emit many ways#
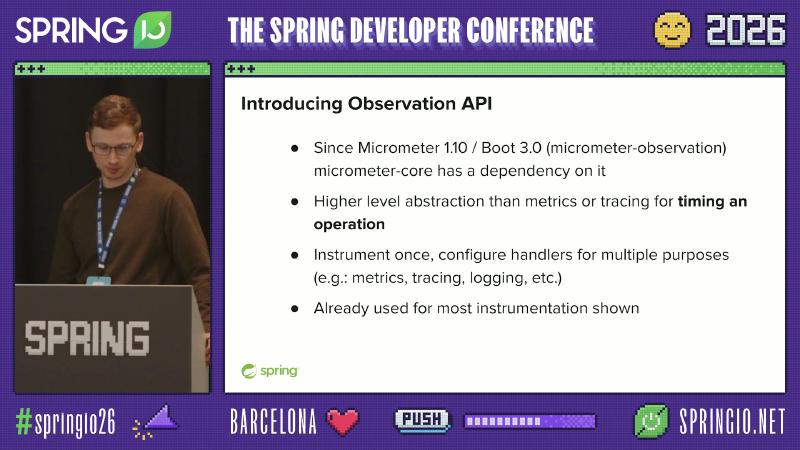
Since Micrometer 1.10 / Boot 3.0, micrometer-observation unifies metrics and tracing at the “time one operation” layer, avoiding three separate instrumentation paths for the same business flow.
Observation observation = Observation.start("my.operation", registry);
try {
  // business work
} catch (Exception ex) {
  observation.error(ex);
  throw ex;
} finally {
  observation.stop();
}
Boot docs also recommend Observation.createNotStarted(...).observe(...)—different API shape, same semantics. Built-in HTTP server/client, DataSource, and more already use Observation; business code must use something like Observation.start("make.tea", registry) on paths such as make.tea to get custom spans that share names with logs and metrics. TracingAwareMeterObservationHandler binds trace and timer and is the hub for exemplars and aligned metric/trace tags.
Global low-cardinality tags can use management.observations.key-values.* for environment, region, etc.; use .highCardinalityKeyValue(...) explicitly for high cardinality so it does not land in Prometheus.
Annotation path (requires management.observations.annotations.enabled=true and AspectJ):
@Observed(name = "tea.make")
@ObservationKeyValue(key = "tea.name", expression = "#name")
public TeaRecipe makeTea(String name) { /* ... */ }
Pitfall: Putting user IDs, full product names, or other high-cardinality dimensions in @ObservationKeyValue and expecting them in Prometheus—cardinality will explode.
Custom ObservationHandler#
Spring Boot auto-configures metrics and tracing handlers and registers ObservationHandler beans in the same ObservationRegistry (Tracing and Observation integration).
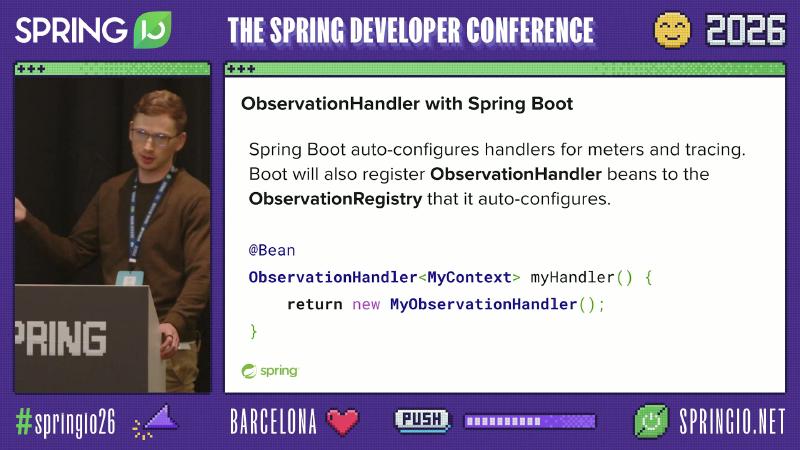
@Bean
ObservationHandler<MyContext> myHandler() {
  return new MyObservationHandler();
}
Use this for audit trails, structured business logging, and other side effects without forking framework HTTP observability. When implementing ObservationHandler, only handle the Context types you care about and narrow supportsContext so you do not slow every HTTP request.
Pitfall: Opening a separate Brave/OTel tracer in the handler to create spans manually—duplicates the built-in tracing handler and causes double spans or split tags.
Three signals compared: when to use which#
| Signal | Best at answering | Typical Teahouse entry |
|---|---|---|
| Logs | Exception type, parameters, business wording | Loki {application="tea-service"} |= "ERROR" |
| Metrics | Error rate, saturation, regression comparison | http_server_requests + outcome / exception |
| Traces | Cross-service order, status per hop, DB child spans | Tempo tea-service: http get /tea/{name} |
They are not substitutes: metrics narrow the time window and service scope, traces lock the trace, logs fill in stack traces and business context. The Observation model’s value is that one Observation.start can drive two of them (metrics + trace) in sync; logs attach via MDC. If you can only land one signal first, prioritize log correlation + trace export (otherwise full metrics cannot tie to a specific request); if you already have Prometheus but no tracing, add exporter and sampling before exemplar drill-down.
Library authors and roadmap: Convention, OTLP, semantic conventions#
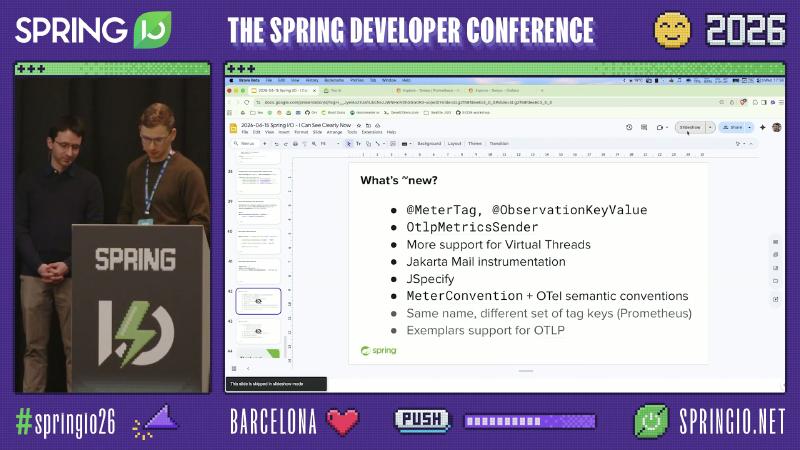
Recent directions include: @MeterTag, OtlpMetricsSender abstraction, MeterConvention alignment with OpenTelemetry Semantic Conventions, virtual threads and Jakarta Mail instrumentation, and more (slide summary—not checked line-by-line against release notes).
Speaker’s view: OTel semantic conventions do not “flip on automatically when you add a dependency”; you still need explicit Convention configuration. On Prometheus you may see same metric name, different tag sets after Micrometer upgrades—read release notes. For library maintainers, @MeterTag vs @ObservationKeyValue splits roughly as: the former fits existing @Timed/MeterRegistry stacks, the latter serves the unified Observation/Tracing pipeline—new libraries should prefer Observation + Convention to reduce rename cost when switching backends.
References and further reading#
- Spring Boot — Observability (overview)
- Spring Boot — Tracing (including logging correlation)
- Spring Boot — Metrics (including Prometheus Exemplars)
- Spring Boot — Logging features
- Spring Boot — Starters list
- Spring Cloud Sleuth reference and migration notes
- Micrometer — Observation components
- Micrometer — Prometheus registry
- Micrometer — OTLP and OtlpMetricsSender
- Micrometer Tracing — Sleuth 3.1 migration Wiki
- Grafana — Tempo datasource
- Grafana — Configure trace to logs
- Prometheus — Exemplars storage feature flag
- OpenTelemetry Semantic Conventions
- OpenMetrics — Exemplars specification