
Feeding JFR Event Streams to AI: An Engineering Path to Centralized JVM Monitoring and JMX Self-Healing#
In microservice incident response, the slowest step is often not opening a JDK Flight Recorder (JFR) recording—it is deciding which JVM and which time window matter. -XX:StartFlightRecording paired with jcmd dumps and manual analysis in Java Mission Control works well on monoliths; once order-service latency traces back to customer-service or product-catalog, engineers logging into machines one by one, pulling files, and aligning timelines often find the root-cause window already closed.
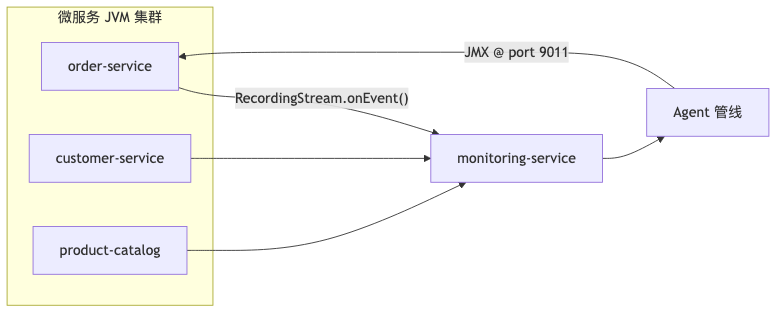
Oracle Java Platform Group engineers Yagmur Eren and Joakim Nordström demonstrated an alternative at Jfokus 2026: each JVM continuously pushes selected events to a central service via RecordingStream; LangChain4j multi-agent workflows interpret and decide; and JMX executes limited self-healing actions remotely. The design treats JFR as continuous telemetry rather than post-incident forensics, and AI as a structured reasoning layer rather than a chat box—connected through explicit schemas, tool calls, and human-confirmation policies. The sections below break down the mechanics by engineering theme; demo numbers and model choices are labeled by source, and API behavior follows JDK 21 documentation.

Why passive dumps fail in microservices#
Why#
JEP 328 made JFR a built-in, low-overhead JDK diagnostic facility, and the java man page supports -XX:StartFlightRecording= at startup. The problem is the operational model: a dump is a post-hoc snapshot, and cross-service causal chains require multiple recordings aligned in time with business requests. The talk used a fictional Galaxy Cafe order topology—order, customer, product-catalog, and shipping each running in container JVMs, with bottlenecks possible at any hop (talk demo scenario, not a public benchmark).
Mechanism and constraints#
The traditional path: jcmd <pid> JFR.dump → download .jfr → analyze in JMC. That model assumes the engineer has already identified the suspect service. In distributed traces, elevated CPU on order-service may be a symptom amplified by downstream HTTP; by the time you confirm “not this service” and dump another machine, the anomaly may have faded. In traffic-spike scenarios such as Interplanetary Galactic Coffee Day, issues can self-heal within tens of seconds, leaving a very narrow overlap window for manual dumps.
Centralized streaming monitoring front-loads collection as normal operations and delegates interpretation to orchestratable software. The monitoring service can retain raw events for post-incident audit in parallel with LLM summaries—AI accelerates triage without replacing compliance retention.
How to#
Architecturally: each microservice → central monitoring-service → AI analysis pipeline → (optional) JMX actions. The demo used HTTP POST per event for transport; production can swap in message queues or gRPC—the JFR API does not prescribe a transport protocol.
Common misconceptions#
- Assuming “JFR is on” equals observability—without centralized aggregation, cross-service correlation still depends on humans.
- Treating AI interpretation as a JMC replacement—LLM output needs structured constraints and human confirmation; it cannot replace raw event archives.
- Ignoring the gap between demo topology and real production—ports, authentication, and retention policies all need separate design.
Controlling event subscriptions and transport cost with JFC#
Why#
EventStream lets you register a generic onEvent(Consumer) for all events. Default Configuration templates enable many event types; if every event is reported over HTTP, a microservice cluster produces significant fan-out (speaker’s view: roughly ninety event types under default config—specific count not verified in the jfr(1) man page). Official performance guidance recommends onEvent(String, Consumer) for known event names rather than filtering inside a generic handler.
Mechanism and constraints#
jfr(1) defines setting keys as <event-name>#<setting-name>=<value>, for example jdk.ThreadCPULoad#enabled=true. Configuration.getSettings() returns Map<String,String>; you can walk #enabled keys to decide the subscription set. RecordingStream.startAsync() consumes asynchronously without blocking business threads.
How to#
The monitoring side pushes a trimmed JFC per service (demo snippet):
jdk.ThreadCPULoad#enabled=true
jdk.ObjectAllocationSample#enabled=true
jdk.ExceptionStatistics#enabled=true
Microservices register handlers selectively:
Configuration config = Configuration.create(configReader);
RecordingStream recording = new RecordingStream(config);
for (var e : config.getSettings().entrySet()) {
  if (e.getKey().endsWith("#enabled") && "true".equals(e.getValue())) {
    String eventName = e.getKey().split("#")[0];
    recording.onEvent(eventName, monitoringClient::handleEvent);
  }
}
recording.startAsync();
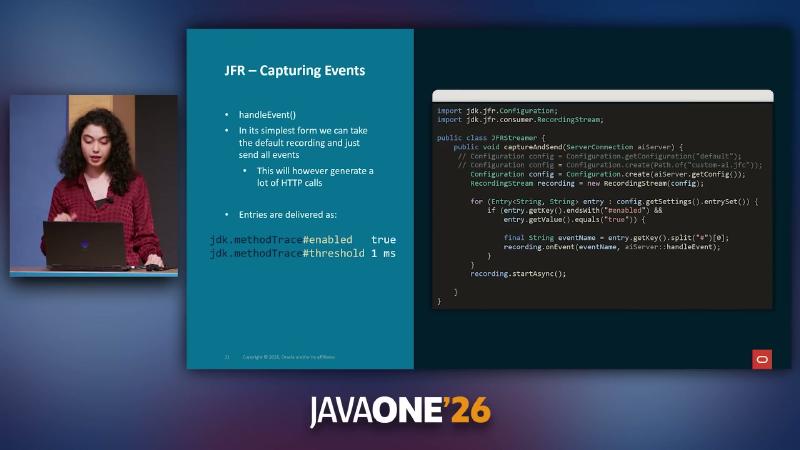
Configuration entries with #enabled true, then recording.onEvent(eventName, handler) and startAsync().
On the monitoring service, handleEvent (demo uses a Spring Web endpoint—not a JFR standard) receives JSON, enqueues it, and AgentWorkflowService triggers the agent pipeline asynchronously—avoiding synchronous LLM calls on JFR callback threads.
Note: Configuration.create() accepts Reader or Path; there is no create(String) overload—remote delivery must use a Reader. Use the jfr metadata subcommand to verify events exist in the target JDK build.
Common misconceptions#
- Calling
onEvent(e -> forward(e))to forward everything—network and serialization cost grows linearly with event types. - Enabling events without
threshold—e.g.jdk.ThreadCPULoad#threshold=1 msfurther reduces noise (supported JFC syntax). - Assuming JFR-side filtering means zero cost on the monitoring side—JSON serialization and batching in
handleEventstill need optimization.
Non-blocking Java Agent integration and centralized configuration#
Why#
Manually changing startup flags and embedding RecordingStream code across many instances is expensive to operate. Java Instrumentation allows hooking logic in premain, and java.lang.instrument requires premain to return quickly so Spring Boot and similar frameworks are not slowed at startup.
Mechanism and constraints#
-javaagent:agent.jar=options runs before main. The demo convention is baseUrl,serviceName for options (custom format, not a JVM standard). The agent pulls GET /configuration from the monitoring service on a separate thread (with a ServiceName header), loads classpath:{serviceName}.jfc, then starts JFRStreamer. The same JVM often exposes JMX in parallel (demo port 9011); the two are not bound at the API level.
How to#
java -javaagent:jfr-agent.jar=http://monitoring:8080,order-service \
  -Dcom.sun.management.jmxremote \
  -Dcom.sun.management.jmxremote.port=9011 \
  -jar order-service.jar
public static void premain(String args, Instrumentation inst) {
  var cfg = parseArgs(args);
  new Thread(() -> new JFRStreamer().captureAndSend(
      new ServerConnection(cfg.baseUrl(), cfg.serviceName())), "jfr-streamer").start();
}
Configuration can load from a custom JFC; Configuration.create(aiServer.getConfig()) pairs with a centralized configuration endpoint.
Common misconceptions#
- Synchronous HTTP in
premain—startup timeout or unreachable monitoring blocks process launch. - Reusing the demo’s JMX “no SSL, no auth” in production—local only; remote monitoring needs TLS and credentials (general JMX practice).
- Forgetting class-loader isolation between agent and application—JFR consumer code should minimize dependencies on application classes.
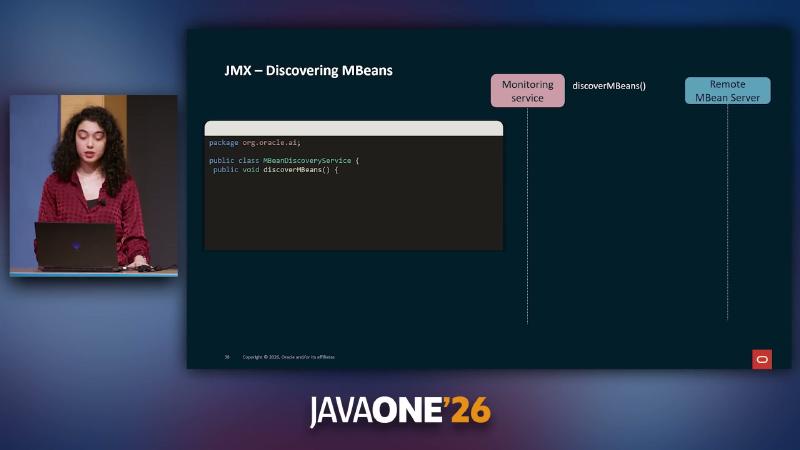
JMX as a runtime control plane and MBean discovery#
Why#
After detecting an anomaly, alerts alone still require someone to log in and change configuration. During peaks, order-service may need to switch from per-request HTTP product fetches (SINGLE) to batch (BATCH); product-catalog may need clearCache to flush search caches. The demo exposes BatchEnabled and clearCache via DynamicMBean for remote monitoring.
Mechanism and constraints#
ManagementFactory.getPlatformMBeanServer() registers ObjectName values such as com.galaxycafe.orders.config:type=SelfHealing,service=order-service. The monitoring side uses JMXConnectorFactory to connect to service:jmx:rmi:///jndi/rmi://host:9011/jmxrmi, queryNames(null,null) to enumerate MBeans, then getMBeanInfo for attribute and operation metadata. type=SelfHealing is a demo filter convention, not a standard JMX type.
How to#
Microservice registration:
ObjectName name = new ObjectName(
    "com.galaxycafe.orders.config:type=SelfHealing,service=order-service");
server.registerMBean(new BatchConfig(), name);
Monitoring-side discovery:
JMXConnector c = JMXConnectorFactory.connect(
    new JMXServiceURL("service:jmx:rmi:///jndi/rmi://order-host:9011/jmxrmi"));
for (ObjectName mbean : c.getMBeanServerConnection().queryNames(null, null)) {
  if ("SelfHealing".equals(mbean.getKeyProperty("type"))) {
    catalog.add(mbean, c.getMBeanServerConnection().getMBeanInfo(mbean));
  }
}
clearCache operation and BatchEnabled attribute map to invoke and getAttribute respectively.
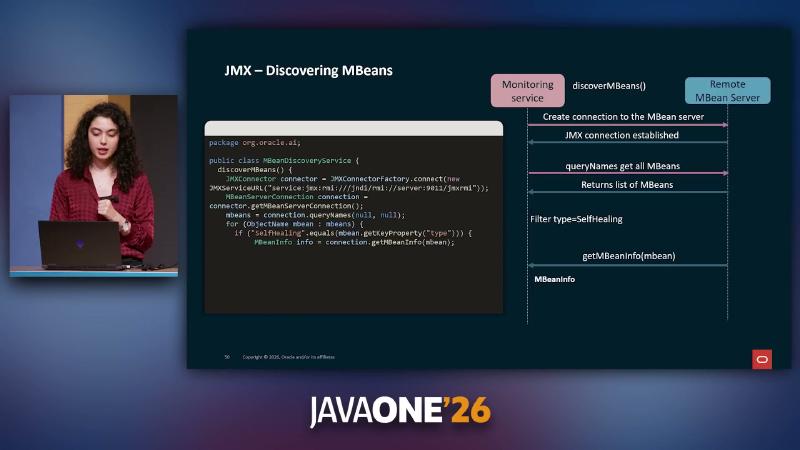
MBeanDiscoveryService uses JMXConnectorFactory.connect and queryNames to find SelfHealing MBeans.
Common misconceptions#
- Using JMX as a configuration center—no version audit or change replay; limit to emergency-toggle-style operations.
- Not restricting
invokepermissions—any client that can reach port 9011 can execute operations. - Assuming one
queryNamescall is enough—refresh the catalog after rolling deploys.
Annotating JMX action semantics for the LLM#
Why#
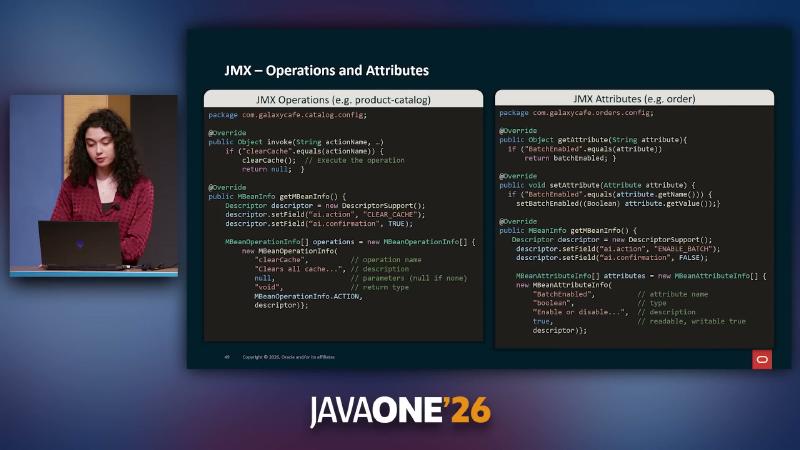
The SelfHealer agent needs to know what can be done on which service. Dumping raw MBean metadata into the prompt makes it hard for the model to distinguish clearCache (needs human confirmation) from ENABLE_BATCH (can run automatically). The demo injects custom Descriptor fields ai.action and ai.confirmation into the system prompt.
Mechanism and constraints#
DescriptorSupport.setField attaches to MBeanOperationInfo (impact=ACTION) and MBeanAttributeInfo. Field semantics are demo conventions—the JMX spec does not recognize ai.* names. ai.confirmation=true means human-in-the-loop; false allows automatic execution (outer audit still recommended).
How to#
Descriptor d = new DescriptorSupport();
d.setField("ai.action", "CLEAR_CACHE");
d.setField("ai.confirmation", "true");
new MBeanOperationInfo("clearCache", "Clears search cache", null,
    "void", MBeanOperationInfo.ACTION, d);

Descriptor ad = new DescriptorSupport();
ad.setField("ai.action", "ENABLE_BATCH");
ad.setField("ai.confirmation", "false");
new MBeanAttributeInfo("BatchEnabled", "boolean",
    "Enable batch product fetch", true, true, false, ad);
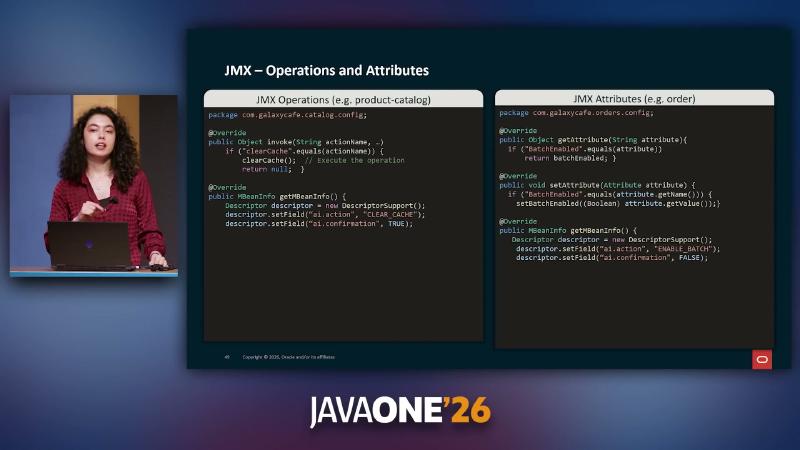
descriptor.setField("ai.action", "CLEAR_CACHE") and ENABLE_BATCH annotate action semantics.
Common misconceptions#
- Labeling action but not confirmation—automatic cache-clear operations carry high risk.
- Assuming the LLM reads JavaDoc—serialize descriptors into a concise action table.
- Treating descriptors as authorization—still validate action allowlists on the server before execution.
Multi-agent roles and tool augmentation#
Why#
A single LLM doing JFR interpretation, anomaly detection, and ops decisions at once often lacks accuracy and explainability (speaker’s view). The demo splits work across three LangChain4j @Agent interfaces: JfrDataProcessor compresses raw events, AnomalyDetector decides, SelfHealer picks actions. @MemoryId isolates session memory by serviceName so order and catalog contexts do not bleed together.
Mechanism and constraints#
The langchain4j-agentic module is marked experimental in official docs; APIs may change. JfrDataProcessor uses @Tool for domain knowledge: readJfrDocumentation loads JfrEventDescriptions.md; fetchOlderEvents widens the time window when evidence is thin. Tool class names and Markdown files are demo implementations, not framework built-ins.
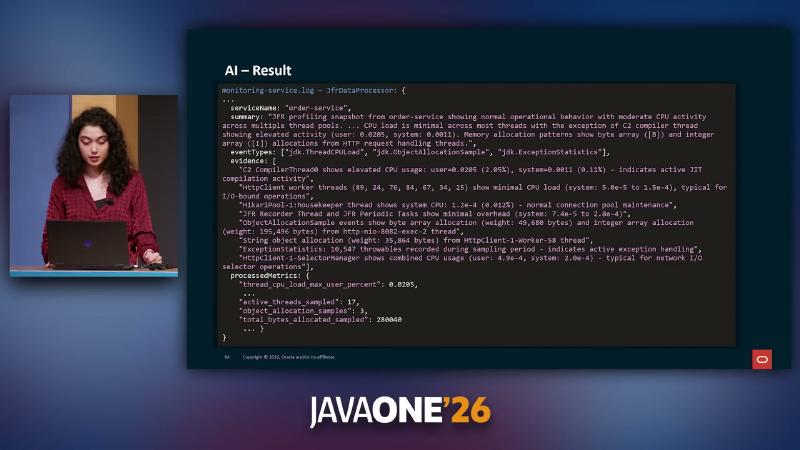
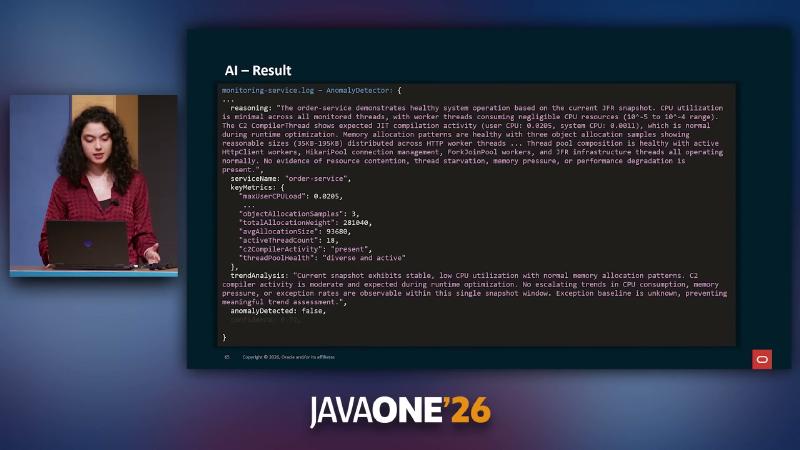
ProcessedJfrContext demo fields include summary, eventTypes, evidence, and processedMetrics. Healthy-runtime summaries describe “moderate CPU across thread pools,” C2 CompilerThread JIT activity, and byte-array allocation patterns—for downstream agents to cite rather than reading the raw event stream directly.
How to#
public interface JfrDataProcessor {
  @Agent("Process raw JFR events into concise LLM-ready context")
  ProcessedJfrContext process(@MemoryId String serviceName,
                              @V("context") String context);
}
class JfrDataProcessorTools {
  @Tool("Read JFR event documentation for event types you're analyzing")
  String readJfrDocumentation() { return loadClasspath("JfrEventDescriptions.md"); }

  @Tool("Fetch older JFR events before earliest timestamp in current window")
  String fetchOlderEvents(String serviceName, String beforeTimestamp) {
    return repo.findOlder(serviceName, beforeTimestamp).toJson();
  }
}
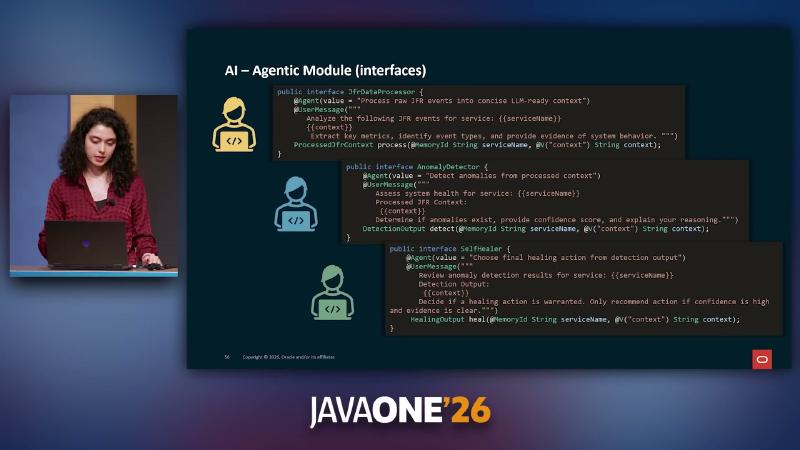
JfrDataProcessor @Agent and @UserMessage turn raw JFR into LLM-readable context.
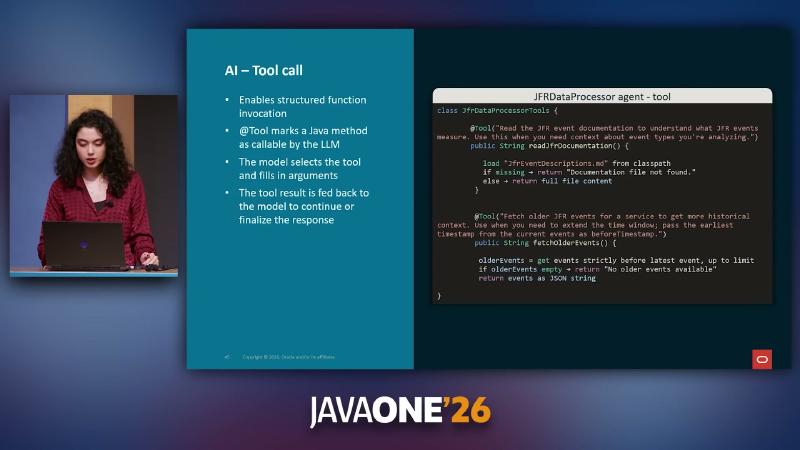
@Tool on readJfrDocumentation in JfrDataProcessorTools lets the model look up event descriptions on demand.
Common misconceptions#
- More agents is always better—cross-agent state transfer cost rises; split at verifiable output boundaries.
- Feeding raw JSON without tools—token explosion and missing semantics for events like
jdk.ThreadCPULoad. - Ignoring
@MemoryIdstorage growth—long runs need TTL or summarization policies.
Structured detection output and workflow orchestration#
Why#
LLMs easily produce confident conclusions with thin evidence. The demo constrains a POJO with @Description: reasoning states the basis first, then anomalyDetected, confidence (0.0–1.0), and moreDataRequired. Field order depends on prompt and model behavior—@Description does not guarantee physical JSON field order (not independently verified).
Mechanism and constraints#
AgenticScope shares state between sub-agents. loopBuilder iterates DataProcessor and AnomalyDetector until !moreDataRequired && confidence >= 0.85 (demo threshold); sequenceBuilder then chains SelfHealer. Current Javadoc differs slightly from talk slides: loop name uses .name("detection-loop"), state read uses readState("detection") rather than scope.get.
How to#
public static class DetectionOutput {
  @Description("What is wrong, or confirmation the system is healthy")
  public String reasoning;
  public boolean anomalyDetected;
  public double confidence;
  public boolean moreDataRequired;
  public Map<String, Object> keyMetrics = Map.of();
}
var detectionLoop = AgenticServices.loopBuilder()
    .name("detection-loop")
    .maxIterations(5)
    .exitCondition(scope -> {
      DetectionOutput d = scope.readState("detection");
      return d != null && !d.moreDataRequired && d.confidence >= 0.85;
    })
    .subAgents(dataProcessor, anomalyDetector)
    .build();

var pipeline = AgenticServices.sequenceBuilder()
    .subAgents(detectionLoop, selfHealer)
    .build();
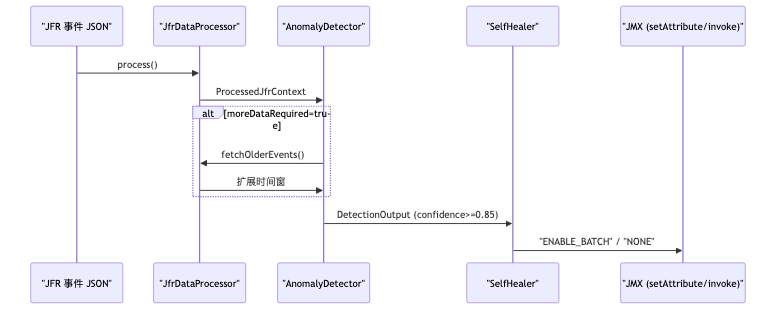
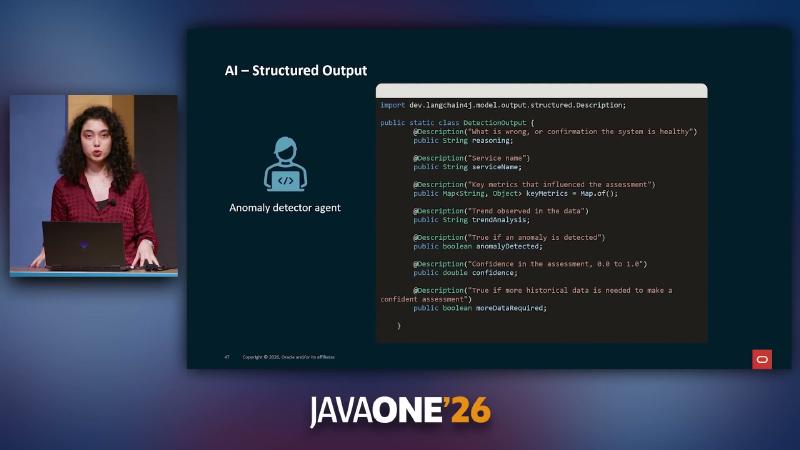
DetectionOutput fields reasoning, confidence, moreDataRequired, and others feed AnomalyDetector.
Common misconceptions#
- Alerting on a single snapshot—run
moreDataRequiredand tool-backed history fetches first. - Treating
confidenceas a statistical confidence interval—it is LLM self-assessment; calibrate with structured outputs and offline evaluation (speaker’s view: chained generation can reduce premature commitment; no matching official doc). - Copying the talk’s
loopBuilder("name")signature—check current LangChain4j Javadoc.
End-to-end self-healing and production boundaries#
Why#
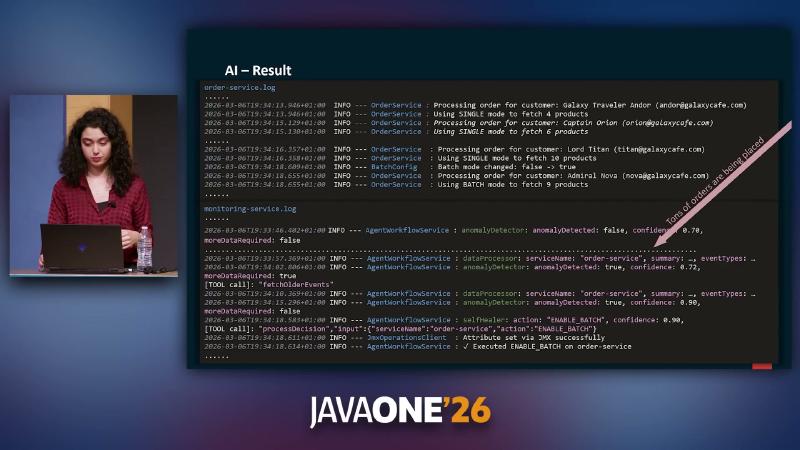
Detection and decisions must be observable. Under synthetic peak traffic, the root-cause narrative is order-service fetching products via per-request HTTP in SINGLE mode, creating N+1-like pressure at the spike. AgentWorkflowService logs show AnomalyDetector first reporting anomalyDetected: true, confidence: 0.72 and triggering [TOOL call]: "fetchOlderEvents"; after widening the window, confidence rises to 0.90. SelfHealer outputs action: "ENABLE_BATCH", confidence: 0.90; JmxOperationsClient logs Attribute set via JMX successfully; order-service logs shift from Using SINGLE mode to fetch 4 products to Using BATCH mode (entire chain from talk OCR/logs; no public repo to reproduce).
Mechanism and constraints#
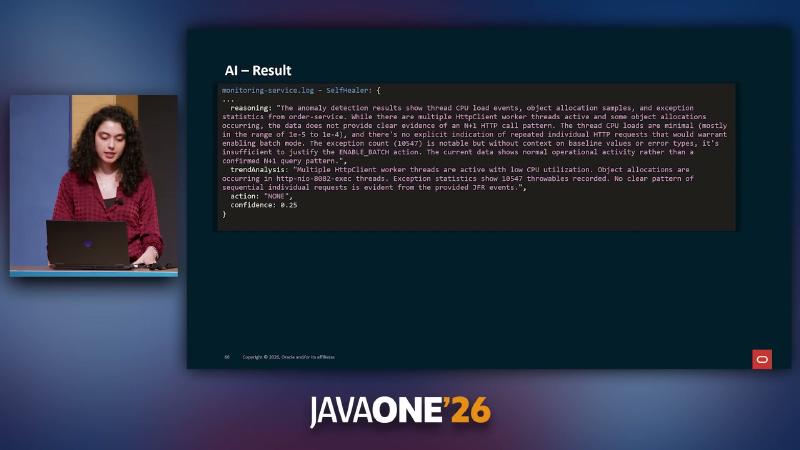
On healthy snapshots, JfrDataProcessor can produce summaries covering jdk.ThreadCPULoad, jdk.ObjectAllocationSample, and jdk.ExceptionStatistics; elevated C2 CompilerThread CPU can be interpreted as normal JIT activity. With insufficient evidence, SelfHealer returns action: "NONE", confidence: 0.25. Model choice was Anthropic Haiku 4.5 (speaker’s view); temperature, false-positive rate, and SLA not verified.
How to#
@Tool("Execute healing action on target microservice via JMX")
void processDecision(String serviceName, String action) {
  if ("ENABLE_BATCH".equals(action)) {
    jmx.setAttribute(serviceName, "BatchEnabled", true);
  }
}
Observable logs (demo):
INFO OrderService : Using SINGLE mode to fetch 4 products
INFO BatchConfig : Batch mode changed: false -> true
INFO OrderService : Using BATCH mode to fetch 9 products
Common misconceptions#
- Treating the demo as production SLA—missing authentication, batched transport, replay testing, and human approval flows.
- Alerting on JIT thread CPU alone—combine
ThreadCPULoadthresholds with business metrics. - Self-healing without rollback—switching
BatchEnabledback to SINGLE needs a runbook or automatic revert conditions. - Treating the fictional dashboard (
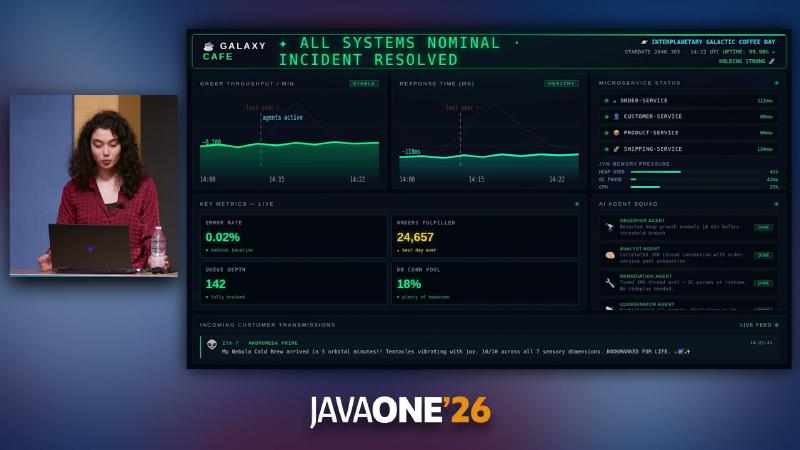
ALL SYSTEMS NOMINAL) as shipped product—narrative prop only, no corresponding open-source implementation.
To experiment in your own environment, a minimal path is: single JVM with trimmed JFC + RecordingStream → monitoring service persistence → one agent for structured summaries; confirm token budget and latency before adding JMX discovery and multi-agent loops. The speakers also have a paper on GC logs + ML for G1 tuning (see Inside.java link at the end)—related topic but no direct code dependency on this architecture.
References and further reading#
- Flight Recorder troubleshooting overview — Oracle JDK 21
- RecordingStream API — JDK 21
- EventStream API — JDK 21
- Configuration API — JDK 21
- jfr(1) command reference — event setting syntax
- JEP 328: Flight Recorder
- java(1) manual — StartFlightRecording and javaagent
- java.lang.instrument package summary — JDK 21
- DynamicMBean API — JDK 21
- JMXConnectorFactory API — JDK 21
- Java Management Extensions (JMX) guide
- LangChain4j Agents and agentic workflow tutorial
- LangChain4j Tools (function calling) tutorial
- LangChain4j Structured Outputs tutorial
- Inside.java: JVM tuning and machine learning thesis (speaker Yagmur Eren)